# Loading required packages
library(readr)
library(tidyverse)
library(dplyr)
library(naniar)
library(skimr)
library(ggplot2)
library(tidymodels)
library(ranger)
library(glmnet)
library(rpart.plot)
library(vip)
library(bonsai)
library(lightgbm)Tidy Tuesday Exercise 2
LOADING REQUIRED PACKAGES
LOADING AND LOOKING TIDYTUESDAY 2023 WEEK 15 (04/11/2023) DATA
# Loading the TidyTuesday 2023 week 15 (04/11/2023) data
egg_production <- read_csv('https://raw.githubusercontent.com/rfordatascience/tidytuesday/master/data/2023/2023-04-11/egg-production.csv')
Rows: 220 Columns: 6
── Column specification ────────────────────────────────────────────────────────
Delimiter: ","
chr (3): prod_type, prod_process, source
dbl (2): n_hens, n_eggs
date (1): observed_month
ℹ Use `spec()` to retrieve the full column specification for this data.
ℹ Specify the column types or set `show_col_types = FALSE` to quiet this message.head(egg_production)# A tibble: 6 × 6
observed_month prod_type prod_process n_hens n_eggs source
<date> <chr> <chr> <dbl> <dbl> <chr>
1 2016-07-31 hatching eggs all 57975000 1147000000 ChicEggs-09-23-…
2 2016-08-31 hatching eggs all 57595000 1142700000 ChicEggs-10-21-…
3 2016-09-30 hatching eggs all 57161000 1093300000 ChicEggs-11-22-…
4 2016-10-31 hatching eggs all 56857000 1126700000 ChicEggs-12-23-…
5 2016-11-30 hatching eggs all 57116000 1096600000 ChicEggs-01-24-…
6 2016-12-31 hatching eggs all 57750000 1132900000 ChicEggs-02-28-…glimpse(egg_production)Rows: 220
Columns: 6
$ observed_month <date> 2016-07-31, 2016-08-31, 2016-09-30, 2016-10-31, 2016-1…
$ prod_type <chr> "hatching eggs", "hatching eggs", "hatching eggs", "hat…
$ prod_process <chr> "all", "all", "all", "all", "all", "all", "all", "all",…
$ n_hens <dbl> 57975000, 57595000, 57161000, 56857000, 57116000, 57750…
$ n_eggs <dbl> 1147000000, 1142700000, 1093300000, 1126700000, 1096600…
$ source <chr> "ChicEggs-09-23-2016.pdf", "ChicEggs-10-21-2016.pdf", "…skim(egg_production)| Name | egg_production |
| Number of rows | 220 |
| Number of columns | 6 |
| _______________________ | |
| Column type frequency: | |
| character | 3 |
| Date | 1 |
| numeric | 2 |
| ________________________ | |
| Group variables | None |
Variable type: character
| skim_variable | n_missing | complete_rate | min | max | empty | n_unique | whitespace |
|---|---|---|---|---|---|---|---|
| prod_type | 0 | 1 | 10 | 13 | 0 | 2 | 0 |
| prod_process | 0 | 1 | 3 | 23 | 0 | 3 | 0 |
| source | 0 | 1 | 23 | 23 | 0 | 108 | 0 |
Variable type: Date
| skim_variable | n_missing | complete_rate | min | max | median | n_unique |
|---|---|---|---|---|---|---|
| observed_month | 0 | 1 | 2016-07-31 | 2021-02-28 | 2018-11-15 | 56 |
Variable type: numeric
| skim_variable | n_missing | complete_rate | mean | sd | p0 | p25 | p50 | p75 | p100 | hist |
|---|---|---|---|---|---|---|---|---|---|---|
| n_hens | 0 | 1 | 110839873 | 124121204 | 13500000 | 17284500 | 59939500 | 125539250 | 341166000 | ▇▁▁▁▂ |
| n_eggs | 0 | 1 | 2606667580 | 3082457619 | 298074240 | 423962023 | 1154550000 | 2963010996 | 8601000000 | ▇▁▁▁▂ |
cage_free_percentages <- read_csv('https://raw.githubusercontent.com/rfordatascience/tidytuesday/master/data/2023/2023-04-11/cage-free-percentages.csv')Rows: 96 Columns: 4
── Column specification ────────────────────────────────────────────────────────
Delimiter: ","
chr (1): source
dbl (2): percent_hens, percent_eggs
date (1): observed_month
ℹ Use `spec()` to retrieve the full column specification for this data.
ℹ Specify the column types or set `show_col_types = FALSE` to quiet this message.head(cage_free_percentages)# A tibble: 6 × 4
observed_month percent_hens percent_eggs source
<date> <dbl> <dbl> <chr>
1 2007-12-31 3.2 NA Egg-Markets-Overview-2019-10-19.pdf
2 2008-12-31 3.5 NA Egg-Markets-Overview-2019-10-19.pdf
3 2009-12-31 3.6 NA Egg-Markets-Overview-2019-10-19.pdf
4 2010-12-31 4.4 NA Egg-Markets-Overview-2019-10-19.pdf
5 2011-12-31 5.4 NA Egg-Markets-Overview-2019-10-19.pdf
6 2012-12-31 6 NA Egg-Markets-Overview-2019-10-19.pdfglimpse(cage_free_percentages)Rows: 96
Columns: 4
$ observed_month <date> 2007-12-31, 2008-12-31, 2009-12-31, 2010-12-31, 2011-1…
$ percent_hens <dbl> 3.20000, 3.50000, 3.60000, 4.40000, 5.40000, 6.00000, 5…
$ percent_eggs <dbl> NA, NA, NA, NA, NA, NA, NA, NA, NA, NA, 9.634938, NA, 9…
$ source <chr> "Egg-Markets-Overview-2019-10-19.pdf", "Egg-Markets-Ove…skim(cage_free_percentages)| Name | cage_free_percentages |
| Number of rows | 96 |
| Number of columns | 4 |
| _______________________ | |
| Column type frequency: | |
| character | 1 |
| Date | 1 |
| numeric | 2 |
| ________________________ | |
| Group variables | None |
Variable type: character
| skim_variable | n_missing | complete_rate | min | max | empty | n_unique | whitespace |
|---|---|---|---|---|---|---|---|
| source | 0 | 1 | 8 | 35 | 0 | 31 | 0 |
Variable type: Date
| skim_variable | n_missing | complete_rate | min | max | median | n_unique |
|---|---|---|---|---|---|---|
| observed_month | 0 | 1 | 2007-12-31 | 2021-02-28 | 2018-11-15 | 91 |
Variable type: numeric
| skim_variable | n_missing | complete_rate | mean | sd | p0 | p25 | p50 | p75 | p100 | hist |
|---|---|---|---|---|---|---|---|---|---|---|
| percent_hens | 0 | 1.00 | 17.95 | 6.58 | 3.20 | 13.46 | 17.30 | 23.46 | 29.20 | ▂▅▇▆▆ |
| percent_eggs | 42 | 0.56 | 17.10 | 4.29 | 9.56 | 14.52 | 16.23 | 19.46 | 24.55 | ▆▇▇▆▇ |
DATA EXPLORATION AND VISUALIZATION
# Lets look at the trend of the number of eggs produced by hatching and table eggs production types in different years
egg_date_prodtype_plot <- ggplot(egg_production, aes(x = observed_month, y = log(n_eggs), color = prod_type)) +
  geom_point() +
  theme_classic() +
  labs(x = "Date", y = "Number of eggs", title = "Eggs production using different production types in different years") +
  theme(axis.text = element_text(face = "bold"), plot.title = element_text(hjust = 0.5, size = 14),
        axis.title = element_text(size = 14))
egg_date_prodtype_plot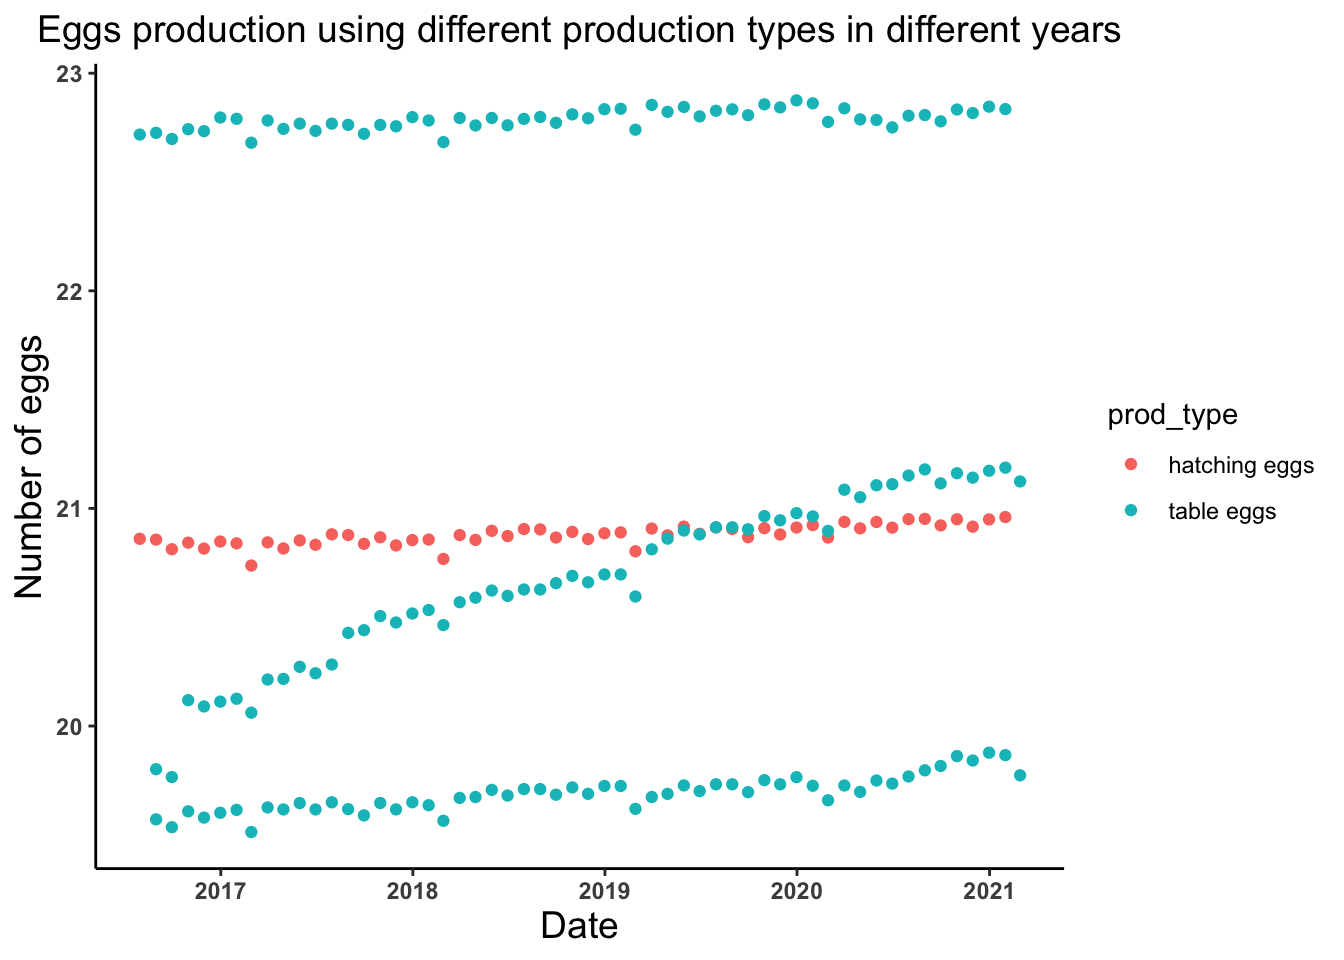
# Lets look at the trend of the number of eggs produced by different production process in different years
egg_date_prodprocess_plot <- ggplot(egg_production, aes(x = observed_month, y = log(n_eggs))) +
  geom_point(aes(color = prod_process)) +
  theme_classic() +
  labs(x = "Date", y = "Number of eggs", title = "Eggs production using different production process over time") +
  theme(axis.text = element_text(face = "bold"), plot.title = element_text(hjust = 0.5, size = 14),
        axis.title = element_text(size = 14))
egg_date_prodprocess_plot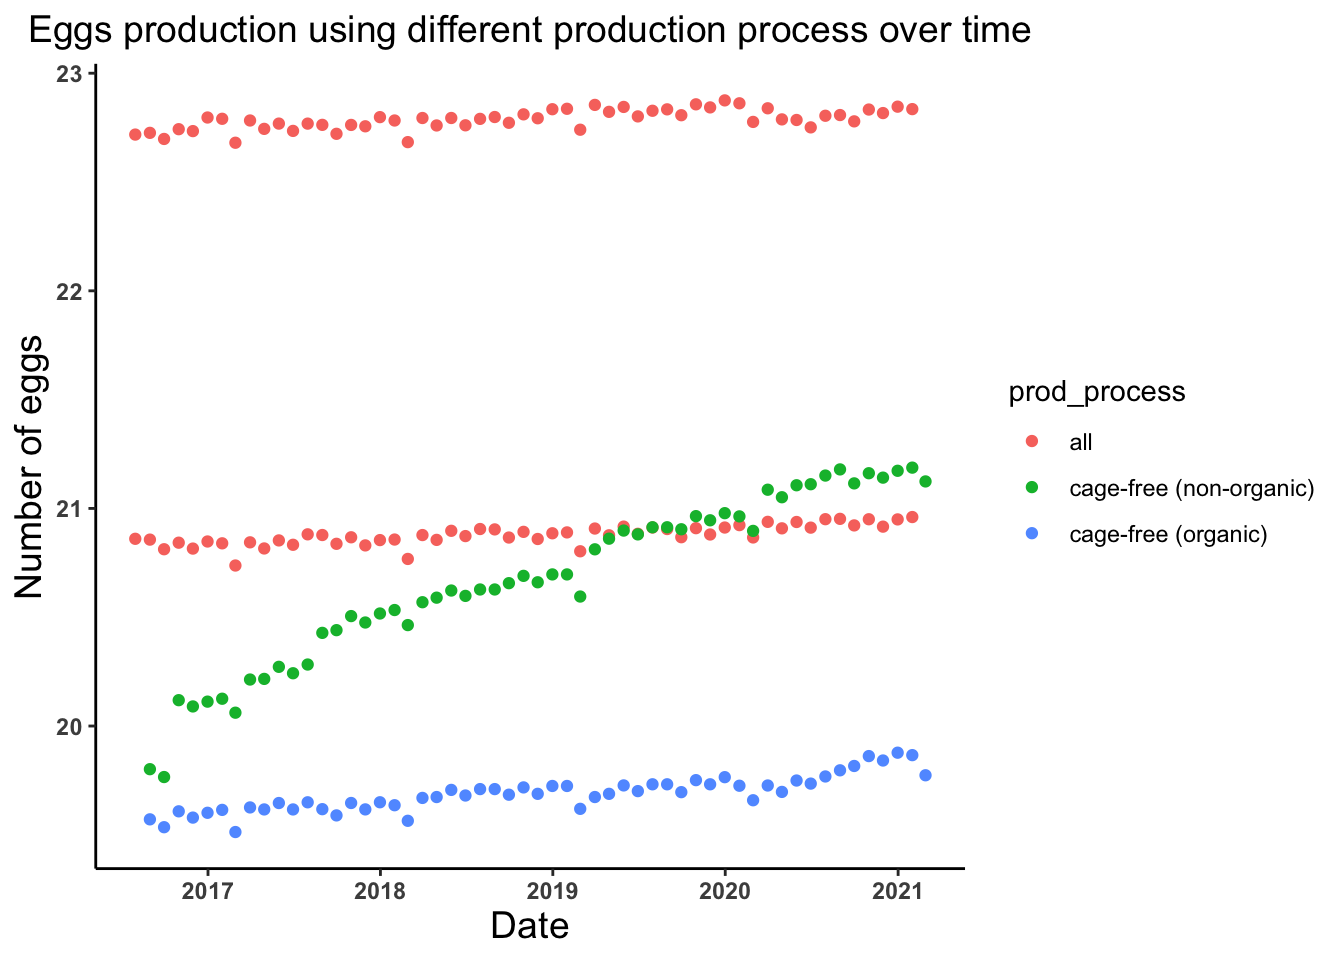
# Lets look at the trend of the number of hens produced by hatching and table eggs production types in different years
hens_date_prodtype_plot <- ggplot(egg_production, aes(x = observed_month, y = log(n_hens))) +
  geom_point(aes(color = prod_type))+
  theme_classic()+
  labs(x = "Date", y = "Number of hens", title = "Hens production using different production types in different years") +
  theme(axis.text = element_text(face = "bold"), plot.title = element_text(hjust = 0.5, size = 14),
        axis.title = element_text(size = 14))
hens_date_prodtype_plot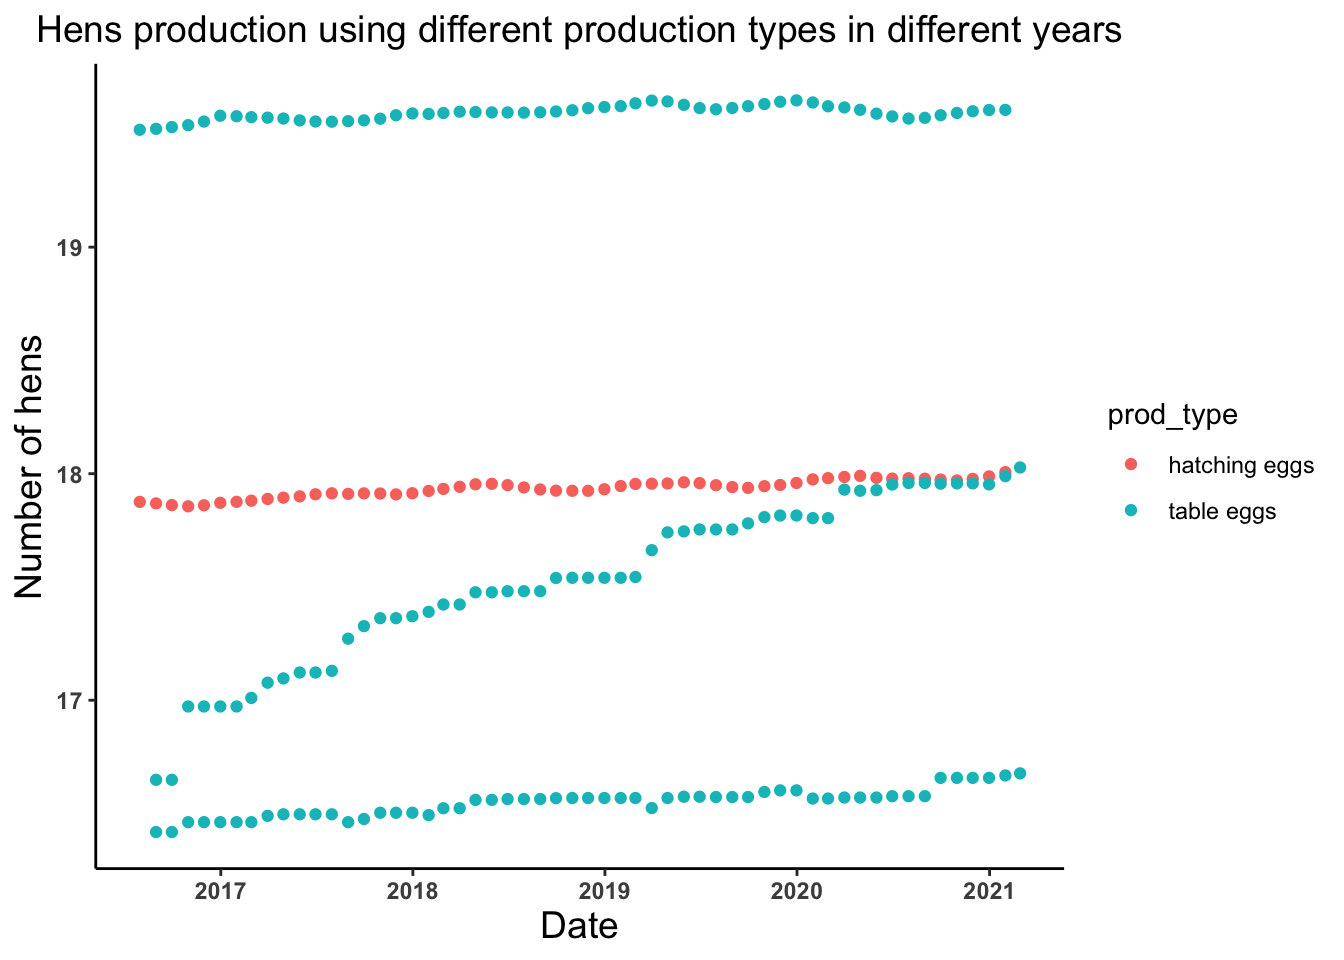
# Lets look at the trend of the number of hens produced by different production process in different years
hens_date_prodprocess_plot <- ggplot(egg_production, aes(x = observed_month, y = log(n_hens))) +
  geom_point(aes(color = prod_process))+
  theme_classic()+
  labs(x = "Date", y = "Number of hens", title = "Hens production using different production process over time") +
  theme(axis.text = element_text(face = "bold"), plot.title = element_text(hjust = 0.5, size = 14),
        axis.title = element_text(size = 14))
hens_date_prodprocess_plot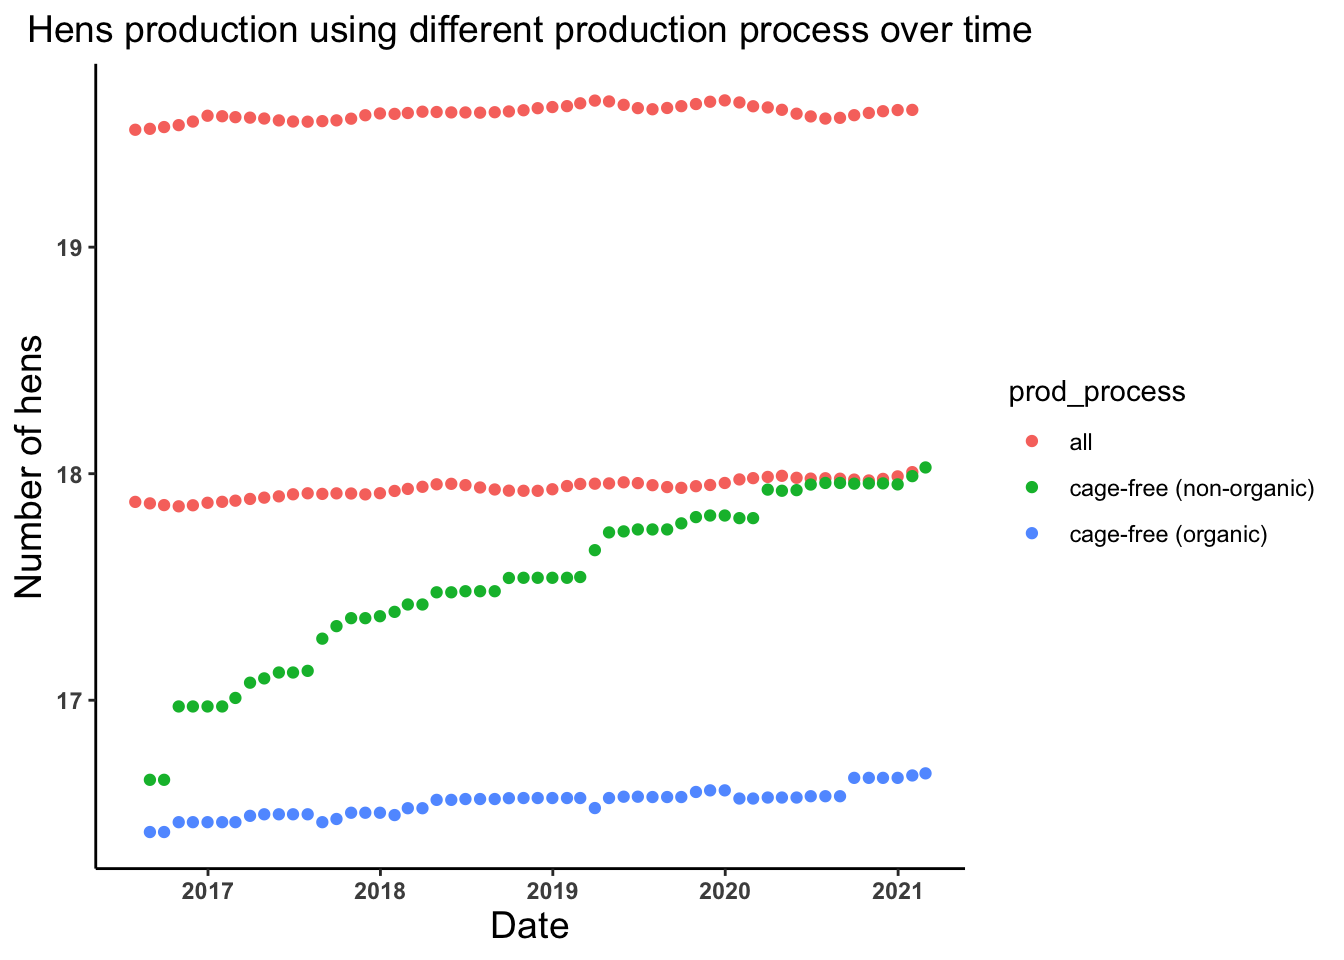
# Lets look at the trend of the percent of cage free eggs produced in different years
cagefreeeggs_date_plot <- ggplot(cage_free_percentages, aes(x = observed_month, y = percent_eggs)) +
  geom_point(color = "red") +
    geom_line(color = "red") +
  theme_classic() +
  labs(x = "Date", y = "Percent of cage free eggs", title = "Percent of cage free eggs in different years") +
  theme(axis.text = element_text(face = "bold"), plot.title = element_text(hjust = 0.5, size = 14),
        axis.title = element_text(size = 14))
cagefreeeggs_date_plot
Warning: Removed 42 rows containing missing values (`geom_point()`).Warning: Removed 11 rows containing missing values (`geom_line()`).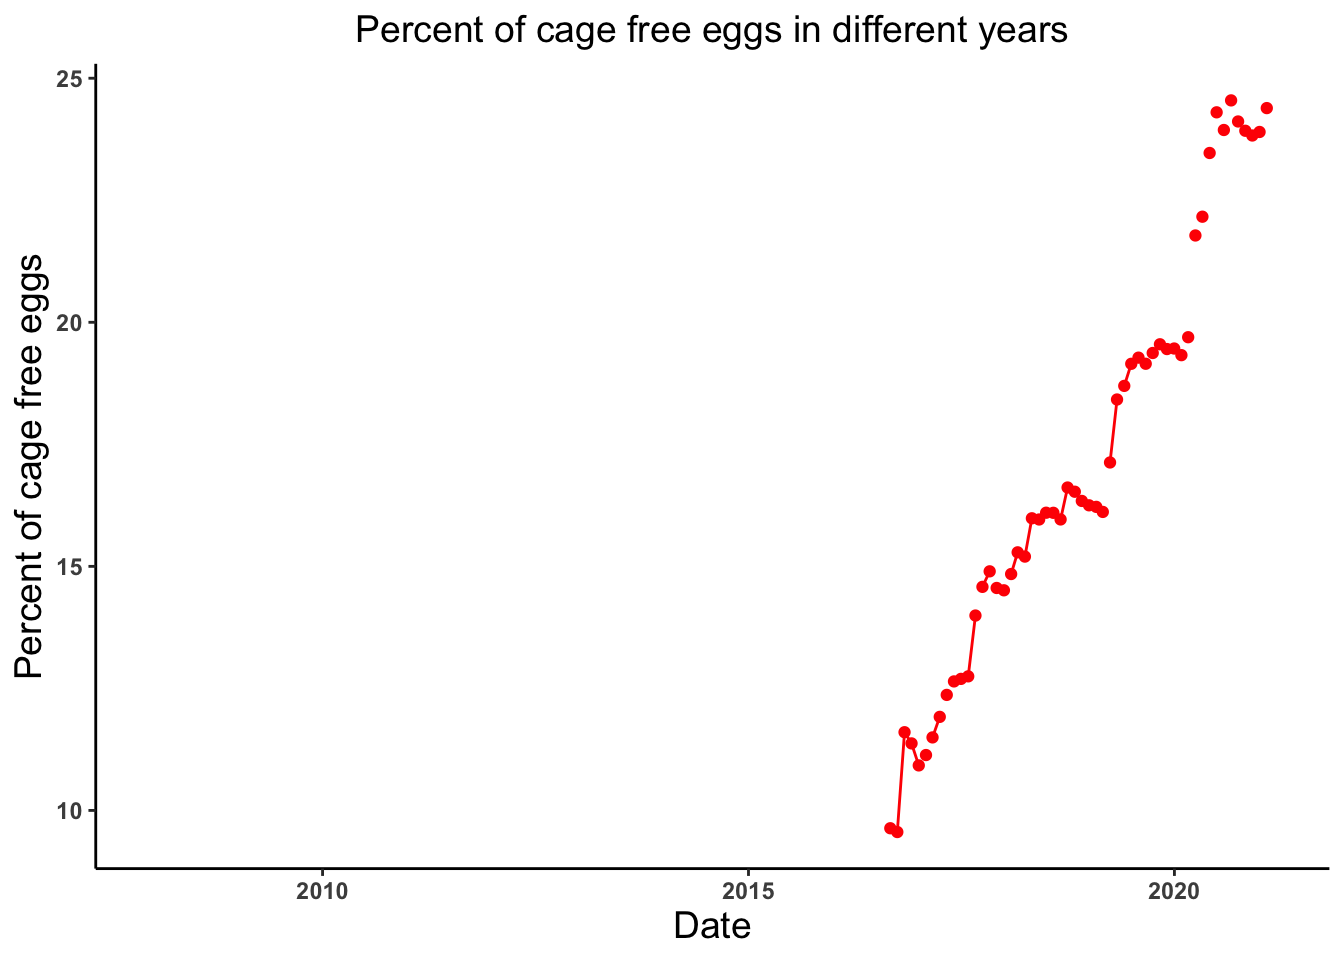
# Lets look at the trend of the percent of cage free hens produced in different years
cagefreehens_date_plot <- ggplot(cage_free_percentages, aes(x = observed_month, y = percent_hens)) +
  geom_point(color = "red") +
  geom_line(color = "red") +
  theme_classic() +
  labs(x = "Date", y = "Percent of cage free hens", title = "Percent of cage free hens in different years") +
  theme(axis.text = element_text(face = "bold"), plot.title = element_text(hjust = 0.5, size = 14),
        axis.title = element_text(size = 14))
cagefreehens_date_plot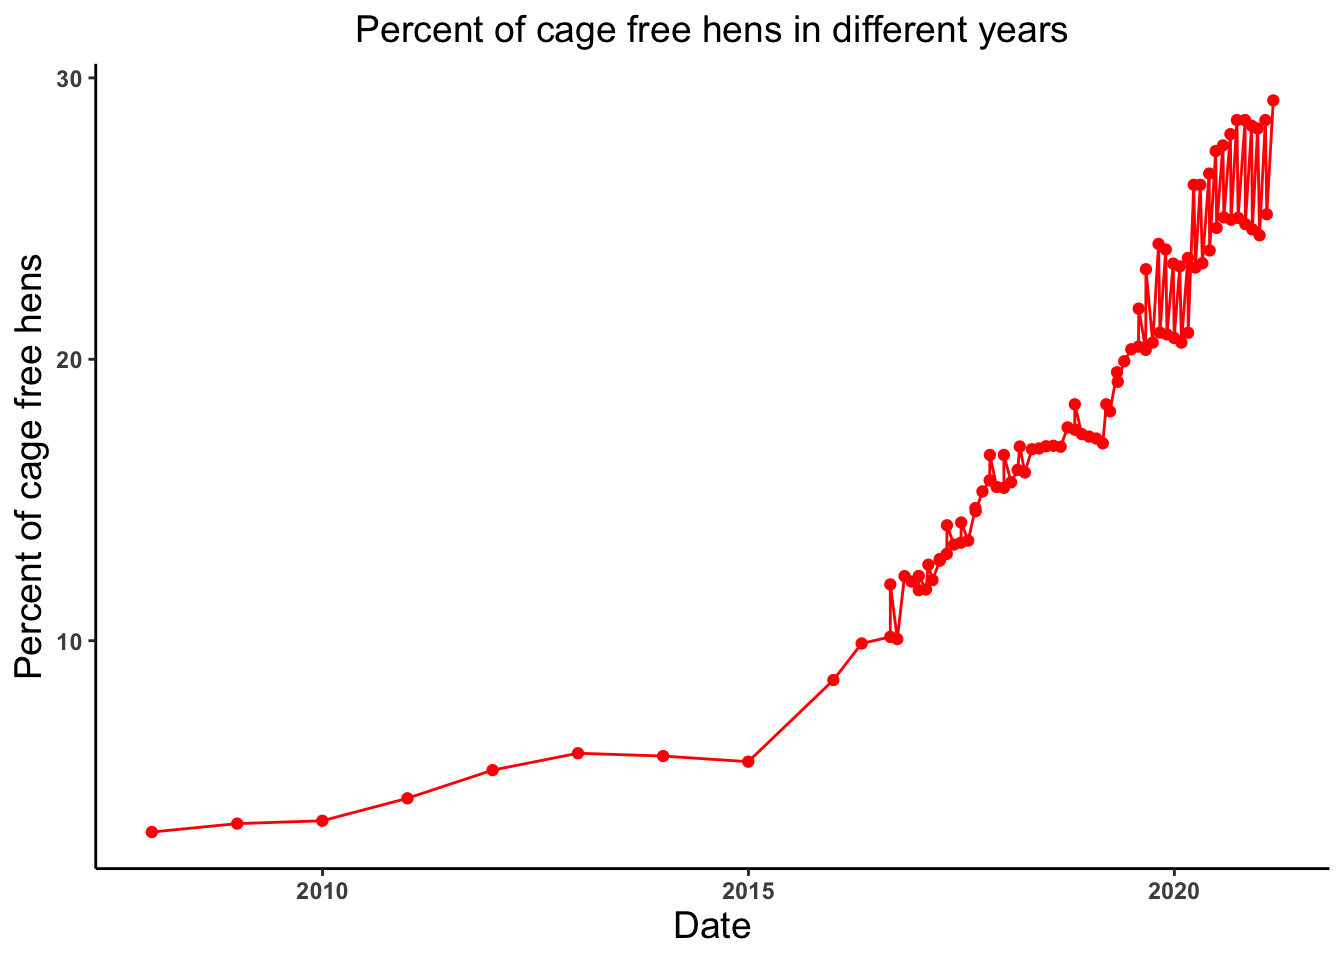
DATA WRANGLING AND VISUALIZATION
# Let's look at the average number of eggs produced per hen so lets create an object named eggs_per_hen
egg_production <- egg_production %>% mutate(eggs_per_hen = n_eggs/n_hens)
summary(egg_production$eggs_per_hen)
Min. 1st Qu. Median Mean 3rd Qu. Max.
17.03 20.66 23.25 22.43 24.03 25.56 # Let's plot average number of eggs produced per hens across different production process and types
eggs_per_hen_plot <- ggplot(egg_production, aes(x = prod_type, y = eggs_per_hen)) +
geom_boxplot(aes(color = prod_process)) +
theme_classic() +
labs(x = "Production type", y = "Eggs per hen", title = "Eggs per hen across different production types and processes") +
theme(axis.text = element_text(face = "bold"), plot.title = element_text(hjust = 0.5, size = 14),
axis.title = element_text(size = 14))
eggs_per_hen_plot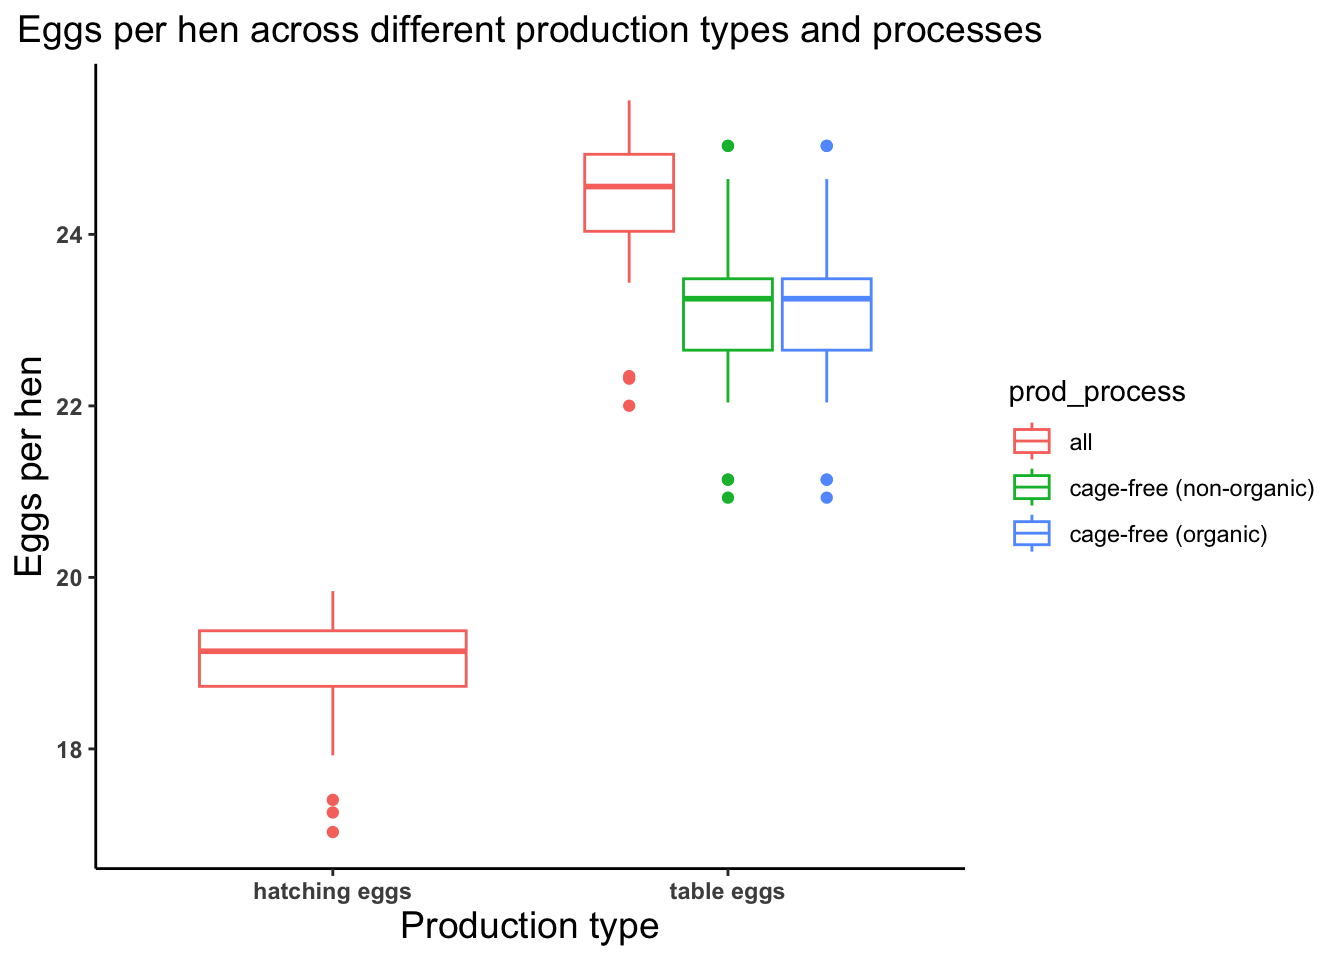
# Let's plot trend of average number of eggs produced per hens in terms of production type
eggs_per_hen_time_plot <- ggplot(egg_production, aes(x = observed_month, y = eggs_per_hen)) +
  geom_line(aes(color = prod_type)) +
  theme_classic() +
  labs(x = "Date", y = "Eggs per hen", title = "Eggs per hen over time in terms of production type") +
  theme(axis.text = element_text(face = "bold"), plot.title = element_text(hjust = 0.5, size = 14),
        axis.title = element_text(size = 14))
eggs_per_hen_time_plot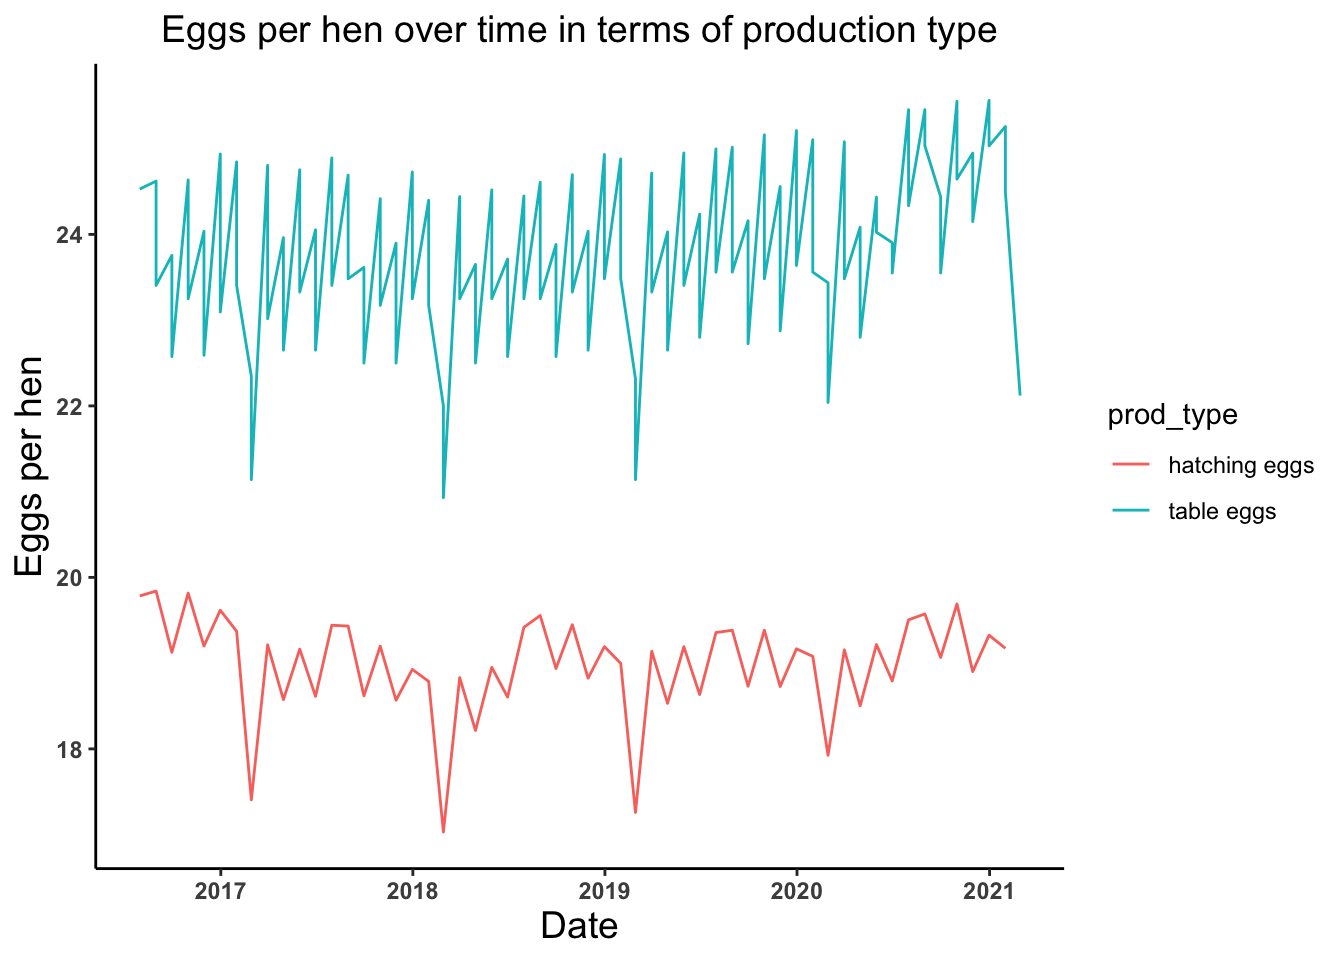
RESEARCH QUESTION
Is there any association between the average number of eggs produced per hens, the production process, and the production types? Outcome: Average number of eggs per hen Predictor: Production type (Hatching or Table eggs) and Production process (all, cage-free (non-organic), and cage-free (organic))
# Let's create a new object to with our research question
eggs_per_hen_prod <- egg_production %>%
  select(prod_type, prod_process, eggs_per_hen)

head(eggs_per_hen_prod)
# A tibble: 6 × 3
prod_type prod_process eggs_per_hen
<chr> <chr> <dbl>
1 hatching eggs all 19.8
2 hatching eggs all 19.8
3 hatching eggs all 19.1
4 hatching eggs all 19.8
5 hatching eggs all 19.2
6 hatching eggs all 19.6DATA SETUP
# Setting the random seed to 123
set.seed(123)

# Splitting dataset
data_split <- initial_split(eggs_per_hen_prod, prop = 3/4)

# Creating data frames for the two sets:
train_data <- training(data_split)
test_data  <- testing(data_split)

# Creating 5-fold cross-validation, 5 times repeated
CV_fold_data <- vfold_cv(train_data, v = 5, repeats = 5)

# Creating a recipe
recipe_data <- recipe(eggs_per_hen ~ ., data = train_data) %>%
  step_dummy(all_nominal(), -all_outcomes())
NULL MODEL PERFORMANCE
# Using train data
# Creating a recipe for null model
recipe_null_train <- recipe(eggs_per_hen ~ 1, data = train_data) %>%
  step_dummy(all_nominal(), -all_outcomes())

# Creating a linear model recipe
recipe_null_logistic <- linear_reg() %>%
  set_engine("lm") %>%
  set_mode("regression")

# Creating workflow pairing model and recipe
workflow_null_train <- workflow() %>%
  add_model(recipe_null_logistic) %>%
  add_recipe(recipe_null_train)

# Fitting null model with the folds created from train data
train_null <- fit_resamples(workflow_null_train, resamples = CV_fold_data)
! Fold1, Repeat1: internal:
There was 1 warning in `dplyr::summarise()`.
ℹ In argument: `.estimate = metric_fn(truth = eggs_per_hen, estimate =...
na_rm = na_rm)`.
Caused by warning:
! A correlation computation is required, but `estimate` is constant an...! Fold2, Repeat1: internal:
There was 1 warning in `dplyr::summarise()`.
ℹ In argument: `.estimate = metric_fn(truth = eggs_per_hen, estimate =...
na_rm = na_rm)`.
Caused by warning:
! A correlation computation is required, but `estimate` is constant an...! Fold3, Repeat1: internal:
There was 1 warning in `dplyr::summarise()`.
ℹ In argument: `.estimate = metric_fn(truth = eggs_per_hen, estimate =...
na_rm = na_rm)`.
Caused by warning:
! A correlation computation is required, but `estimate` is constant an...! Fold4, Repeat1: internal:
There was 1 warning in `dplyr::summarise()`.
ℹ In argument: `.estimate = metric_fn(truth = eggs_per_hen, estimate =...
na_rm = na_rm)`.
Caused by warning:
! A correlation computation is required, but `estimate` is constant an...! Fold5, Repeat1: internal:
There was 1 warning in `dplyr::summarise()`.
ℹ In argument: `.estimate = metric_fn(truth = eggs_per_hen, estimate =...
na_rm = na_rm)`.
Caused by warning:
! A correlation computation is required, but `estimate` is constant an...! Fold1, Repeat2: internal:
There was 1 warning in `dplyr::summarise()`.
ℹ In argument: `.estimate = metric_fn(truth = eggs_per_hen, estimate =...
na_rm = na_rm)`.
Caused by warning:
! A correlation computation is required, but `estimate` is constant an...! Fold2, Repeat2: internal:
There was 1 warning in `dplyr::summarise()`.
ℹ In argument: `.estimate = metric_fn(truth = eggs_per_hen, estimate =...
na_rm = na_rm)`.
Caused by warning:
! A correlation computation is required, but `estimate` is constant an...! Fold3, Repeat2: internal:
There was 1 warning in `dplyr::summarise()`.
ℹ In argument: `.estimate = metric_fn(truth = eggs_per_hen, estimate =...
na_rm = na_rm)`.
Caused by warning:
! A correlation computation is required, but `estimate` is constant an...! Fold4, Repeat2: internal:
There was 1 warning in `dplyr::summarise()`.
ℹ In argument: `.estimate = metric_fn(truth = eggs_per_hen, estimate =...
na_rm = na_rm)`.
Caused by warning:
! A correlation computation is required, but `estimate` is constant an...! Fold5, Repeat2: internal:
There was 1 warning in `dplyr::summarise()`.
ℹ In argument: `.estimate = metric_fn(truth = eggs_per_hen, estimate =...
na_rm = na_rm)`.
Caused by warning:
! A correlation computation is required, but `estimate` is constant an...! Fold1, Repeat3: internal:
There was 1 warning in `dplyr::summarise()`.
ℹ In argument: `.estimate = metric_fn(truth = eggs_per_hen, estimate =...
na_rm = na_rm)`.
Caused by warning:
! A correlation computation is required, but `estimate` is constant an...! Fold2, Repeat3: internal:
There was 1 warning in `dplyr::summarise()`.
ℹ In argument: `.estimate = metric_fn(truth = eggs_per_hen, estimate =...
na_rm = na_rm)`.
Caused by warning:
! A correlation computation is required, but `estimate` is constant an...! Fold3, Repeat3: internal:
There was 1 warning in `dplyr::summarise()`.
ℹ In argument: `.estimate = metric_fn(truth = eggs_per_hen, estimate =...
na_rm = na_rm)`.
Caused by warning:
! A correlation computation is required, but `estimate` is constant an...! Fold4, Repeat3: internal:
There was 1 warning in `dplyr::summarise()`.
ℹ In argument: `.estimate = metric_fn(truth = eggs_per_hen, estimate =...
na_rm = na_rm)`.
Caused by warning:
! A correlation computation is required, but `estimate` is constant an...! Fold5, Repeat3: internal:
There was 1 warning in `dplyr::summarise()`.
ℹ In argument: `.estimate = metric_fn(truth = eggs_per_hen, estimate =...
na_rm = na_rm)`.
Caused by warning:
! A correlation computation is required, but `estimate` is constant an...! Fold1, Repeat4: internal:
There was 1 warning in `dplyr::summarise()`.
ℹ In argument: `.estimate = metric_fn(truth = eggs_per_hen, estimate =...
na_rm = na_rm)`.
Caused by warning:
! A correlation computation is required, but `estimate` is constant an...! Fold2, Repeat4: internal:
There was 1 warning in `dplyr::summarise()`.
ℹ In argument: `.estimate = metric_fn(truth = eggs_per_hen, estimate =...
na_rm = na_rm)`.
Caused by warning:
! A correlation computation is required, but `estimate` is constant an...! Fold3, Repeat4: internal:
There was 1 warning in `dplyr::summarise()`.
ℹ In argument: `.estimate = metric_fn(truth = eggs_per_hen, estimate =...
na_rm = na_rm)`.
Caused by warning:
! A correlation computation is required, but `estimate` is constant an...! Fold4, Repeat4: internal:
There was 1 warning in `dplyr::summarise()`.
ℹ In argument: `.estimate = metric_fn(truth = eggs_per_hen, estimate =...
na_rm = na_rm)`.
Caused by warning:
! A correlation computation is required, but `estimate` is constant an...! Fold5, Repeat4: internal:
There was 1 warning in `dplyr::summarise()`.
ℹ In argument: `.estimate = metric_fn(truth = eggs_per_hen, estimate =...
na_rm = na_rm)`.
Caused by warning:
! A correlation computation is required, but `estimate` is constant an...! Fold1, Repeat5: internal:
There was 1 warning in `dplyr::summarise()`.
ℹ In argument: `.estimate = metric_fn(truth = eggs_per_hen, estimate =...
na_rm = na_rm)`.
Caused by warning:
! A correlation computation is required, but `estimate` is constant an...! Fold2, Repeat5: internal:
There was 1 warning in `dplyr::summarise()`.
ℹ In argument: `.estimate = metric_fn(truth = eggs_per_hen, estimate =...
na_rm = na_rm)`.
Caused by warning:
! A correlation computation is required, but `estimate` is constant an...! Fold3, Repeat5: internal:
There was 1 warning in `dplyr::summarise()`.
ℹ In argument: `.estimate = metric_fn(truth = eggs_per_hen, estimate =...
na_rm = na_rm)`.
Caused by warning:
! A correlation computation is required, but `estimate` is constant an...! Fold4, Repeat5: internal:
There was 1 warning in `dplyr::summarise()`.
ℹ In argument: `.estimate = metric_fn(truth = eggs_per_hen, estimate =...
na_rm = na_rm)`.
Caused by warning:
! A correlation computation is required, but `estimate` is constant an...! Fold5, Repeat5: internal:
There was 1 warning in `dplyr::summarise()`.
ℹ In argument: `.estimate = metric_fn(truth = eggs_per_hen, estimate =...
na_rm = na_rm)`.
Caused by warning:
! A correlation computation is required, but `estimate` is constant an...# Computing RMSE for train data
metrics_null_train <- collect_metrics(train_null)
metrics_null_train# A tibble: 2 × 6
.metric .estimator mean n std_err .config
<chr> <chr> <dbl> <int> <dbl> <chr>
1 rmse standard 2.20 25 0.0417 Preprocessor1_Model1
2 rsq standard NaN 0 NA Preprocessor1_Model1From the null model, we got RMSE as 2.16.
1. DECISION TREE MODEL
# Tuning hyperparameters by creating model specification that identifies which hyperparameters we are planning to tune
tune_tree_model <-
  decision_tree(
    cost_complexity = tune(),
    tree_depth = tune()) %>%
  set_engine("rpart") %>%
  set_mode("regression")
tune_tree_model
Decision Tree Model Specification (regression)
Main Arguments:
cost_complexity = tune()
tree_depth = tune()
Computational engine: rpart # Creating a regular grid of values for using some convenience functions for each hyperparameter
tree_grid <- grid_regular(cost_complexity(), tree_depth(), levels = 5)
tree_grid %>% count(tree_depth)# A tibble: 5 × 2
tree_depth n
<int> <int>
1 1 5
2 4 5
3 8 5
4 11 5
5 15 5# Tuning the workflow using model specification and recipe and model
tree_wf <- workflow() %>%
add_model(tune_tree_model) %>%
add_recipe(recipe_data)
# Tuning using cross-validation and the tune_grid() function
tree_res <- tree_wf %>%
tune_grid(resamples = CV_fold_data,
grid = tree_grid)
# Plotting the above results
tree_res %>% autoplot()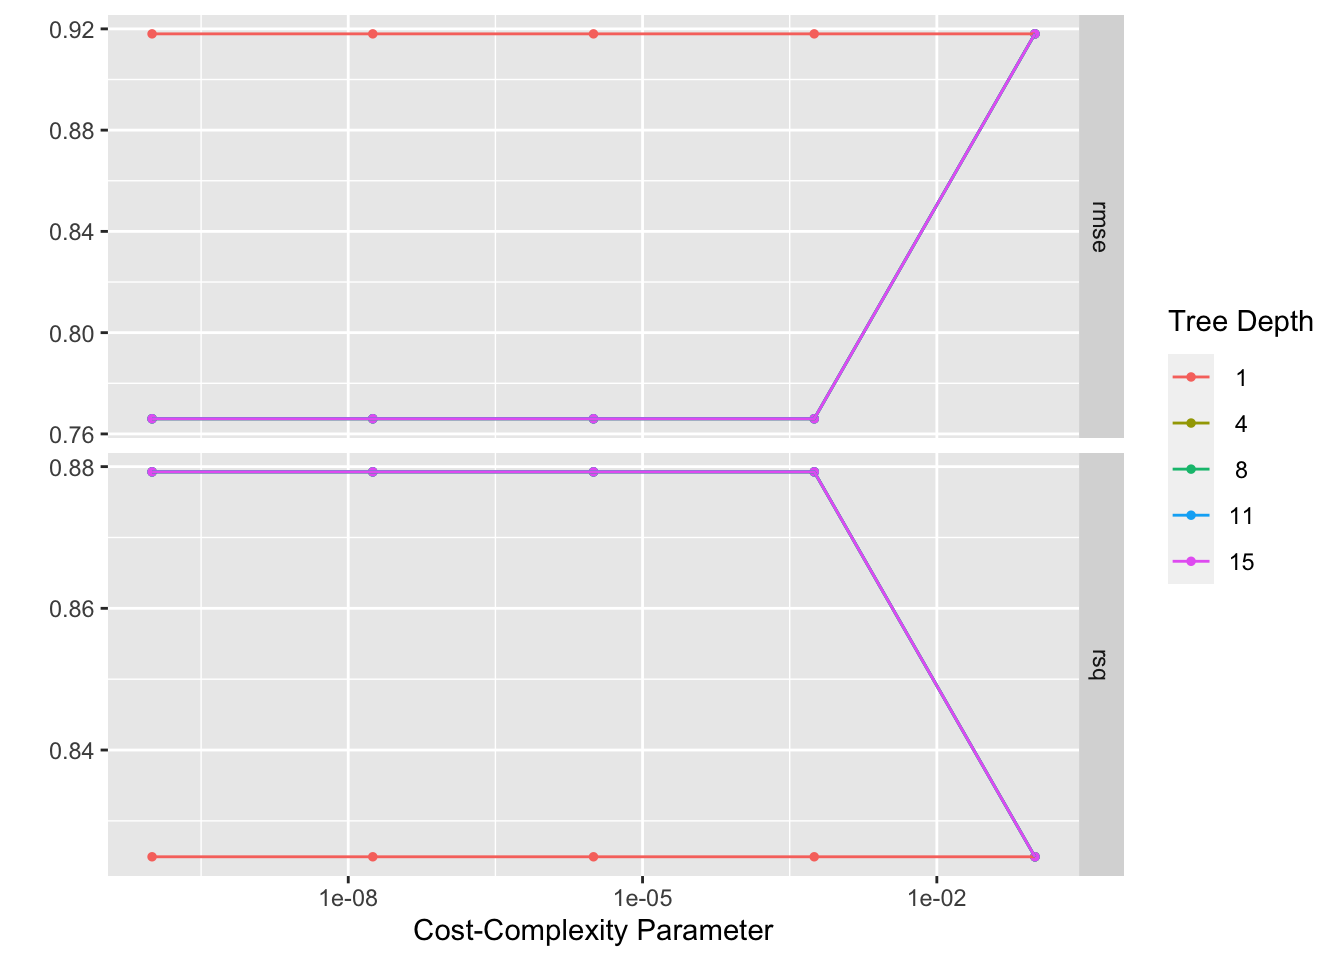
# Getting the best-fit model
tree_res %>%
  show_best()
Warning: No value of `metric` was given; metric 'rmse' will be used.# A tibble: 5 × 8
cost_complexity tree_depth .metric .estimator mean n std_err .config
<dbl> <int> <chr> <chr> <dbl> <int> <dbl> <chr>
1 0.0000000001 4 rmse standard 0.766 25 0.0209 Preprocesso…
2 0.0000000178 4 rmse standard 0.766 25 0.0209 Preprocesso…
3 0.00000316 4 rmse standard 0.766 25 0.0209 Preprocesso…
4 0.000562 4 rmse standard 0.766 25 0.0209 Preprocesso…
5 0.0000000001 8 rmse standard 0.766 25 0.0209 Preprocesso…best_tree <- tree_res %>%
select_best(metric = "rmse")
# Getting summary table for best decision tree model
best_decisiontree <- tree_res %>% show_best("rmse", n = 1) %>%
select(c(.metric, mean, std_err)) %>%
mutate(model = "Decision Tree Model")
# Getting the final workflow
final_wf <- tree_wf %>%
finalize_workflow(best_tree)
# Fitting to the training data with the final workflow
final_fit <- final_wf %>%
fit(train_data)
# Plotting the final fit
rpart.plot(extract_fit_parsnip(final_fit)$fit, roundint = FALSE)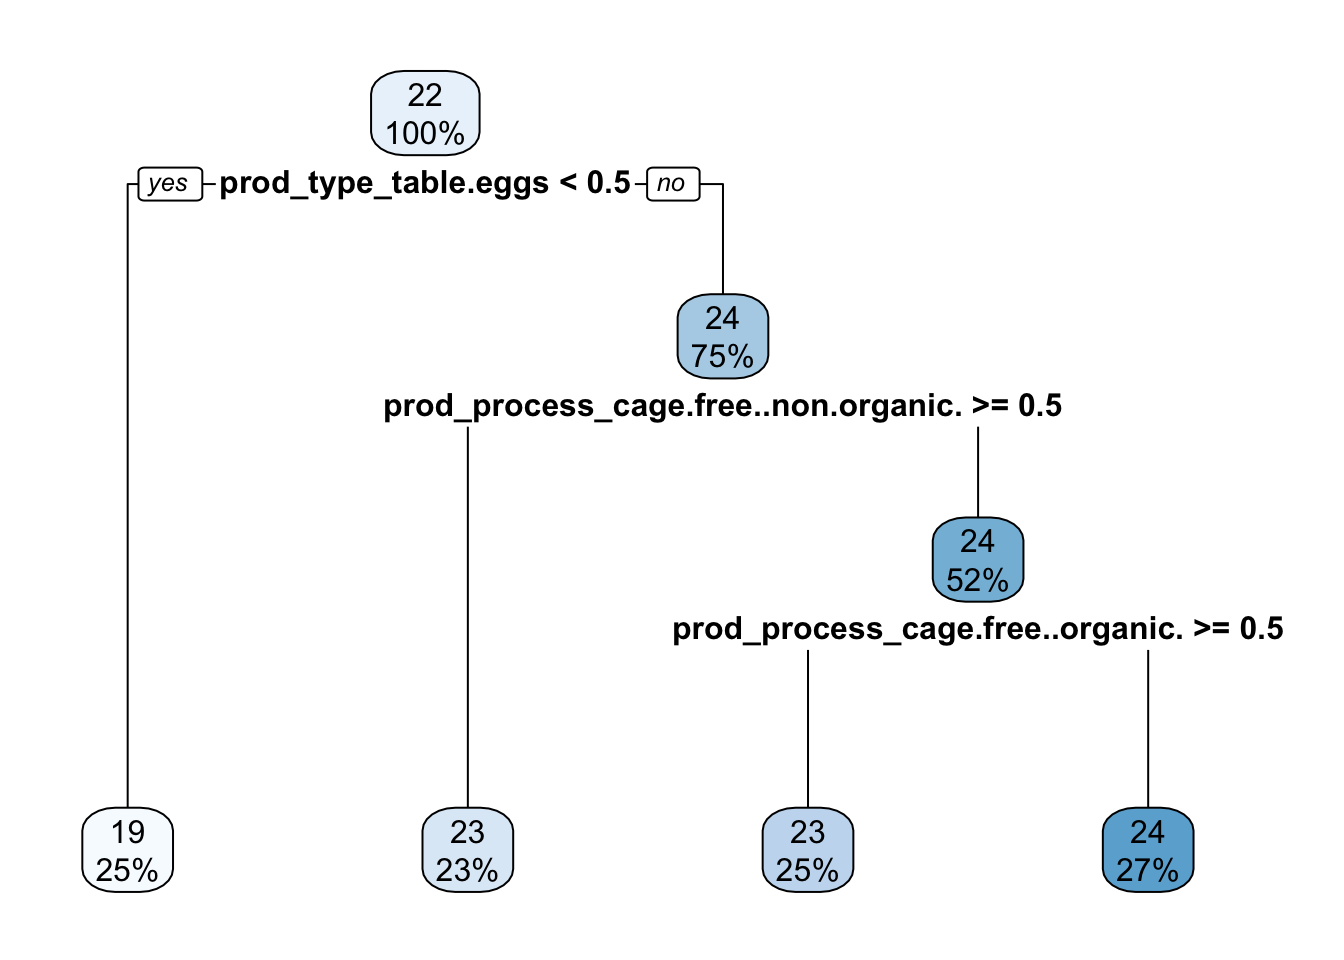
# Predicted outcomes
predicted_fit <- predict(final_fit, train_data)
From the tree model, we got RMSE as 0.77.
2. LASSO MODEL
# Building the model
model_lasso <- linear_reg(penalty = tune(), mixture = 1) %>% set_engine("glmnet") %>% set_mode("regression")

# We will be using the recipe (recipe_data) that we created above
# Creating the workflow
wf_lasso <- workflow() %>%
  add_model(model_lasso) %>%
  add_recipe(recipe_data)

# Model tuning using grid
lasso_grid <- tibble(penalty = 10^seq(-4, -1, length.out = 30))

# Tuning the model using tune_grid() function
res_lasso <- wf_lasso %>% tune_grid(resamples = CV_fold_data, grid = lasso_grid,
    control = control_grid(save_pred = TRUE))

# Plotting the above results
res_lasso %>% autoplot()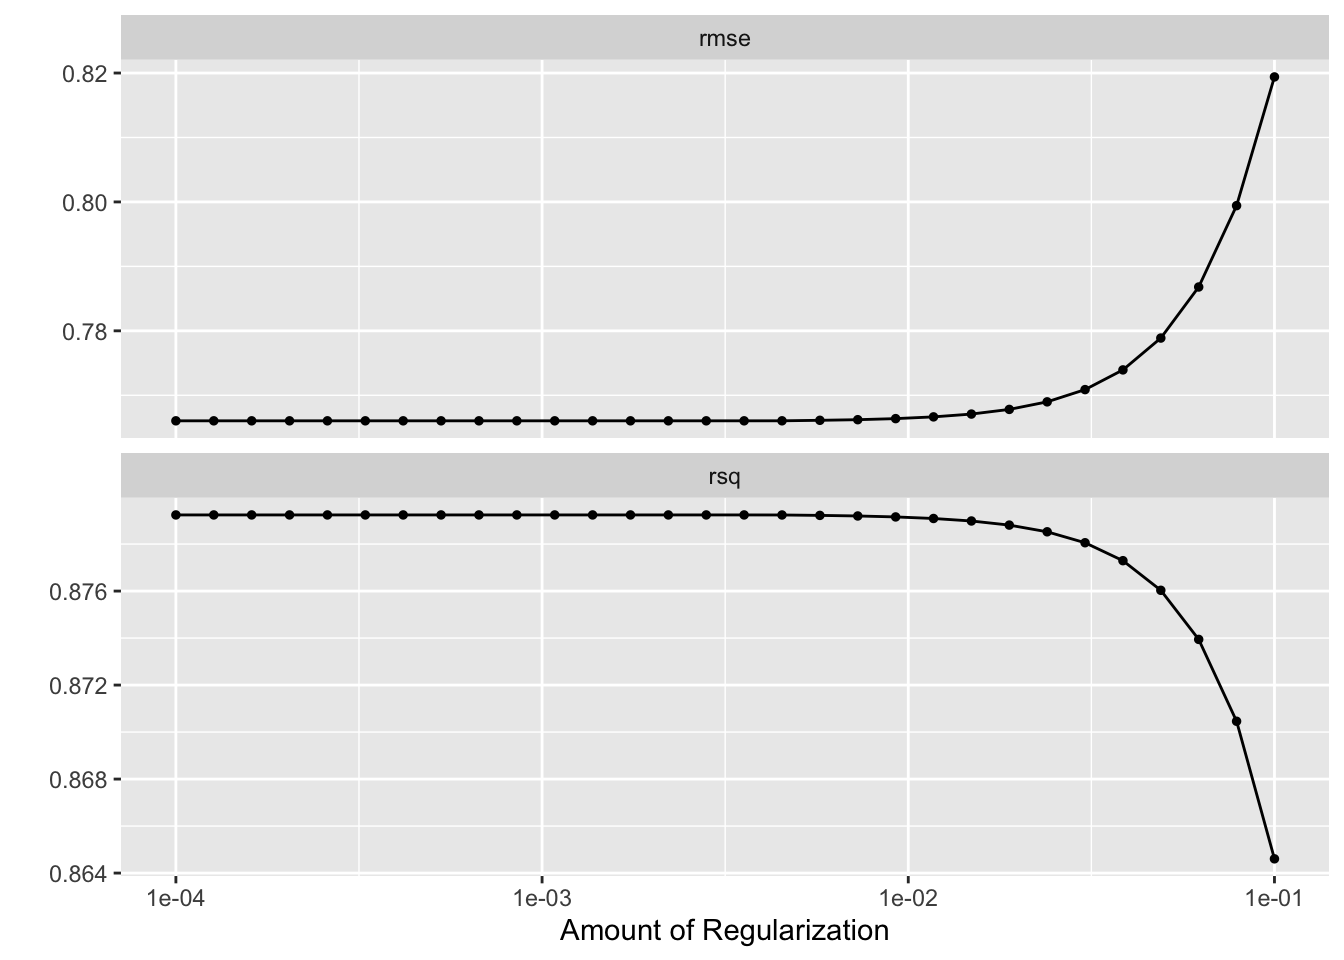
# Getting the best-fit model
res_lasso %>%
  show_best()
Warning: No value of `metric` was given; metric 'rmse' will be used.# A tibble: 5 × 7
penalty .metric .estimator mean n std_err .config
<dbl> <chr> <chr> <dbl> <int> <dbl> <chr>
1 0.0001 rmse standard 0.766 25 0.0209 Preprocessor1_Model01
2 0.000127 rmse standard 0.766 25 0.0209 Preprocessor1_Model02
3 0.000161 rmse standard 0.766 25 0.0209 Preprocessor1_Model03
4 0.000204 rmse standard 0.766 25 0.0209 Preprocessor1_Model04
5 0.000259 rmse standard 0.766 25 0.0209 Preprocessor1_Model05best_lasso <- res_lasso %>%
select_best(metric = "rmse")
# Getting summary table for best lasso model
best_lasso <- res_lasso %>% show_best("rmse", n = 1) %>%
select(c(.metric, mean, std_err)) %>%
mutate(model = "Lasso Model")
# Getting the final workflow
final_lasso_wf <- wf_lasso %>%
finalize_workflow(best_lasso)
# Fitting to the training data with the final workflow
final_lasso_fit <- final_lasso_wf %>% fit(train_data)
# Plotting the final fit
plot_lasso <- extract_fit_engine(final_lasso_fit)
plot(plot_lasso, "lambda")
From the Lasso model, we got RMSE as 0.77.
3. RANDOM FOREST MODEL
# Detecting the cores
cores <- parallel::detectCores()
cores
[1] 8# Building the model
model_randomforest <- rand_forest(mtry = tune(), min_n = tune(), trees = 1000) %>%
set_engine("ranger",importance = "impurity", num.threads = cores) %>%
set_mode("regression")
# We will be using the recipe (recipe_data) that we created above
# Creating the workflow
wf_randomforest <- workflow() %>%
add_model(model_randomforest) %>%
add_recipe(recipe_data)
# Model tuning
extract_parameter_set_dials(model_randomforest)Collection of 2 parameters for tuning
identifier type object
mtry mtry nparam[?]
min_n min_n nparam[+]
Model parameters needing finalization:
# Randomly Selected Predictors ('mtry')
See `?dials::finalize` or `?dials::update.parameters` for more information.# Tuning the model using tune_grid() function
res_randomforest <- wf_randomforest %>% tune_grid(resamples = CV_fold_data, grid = 25,
control = control_grid(save_pred = TRUE), metrics = NULL)i Creating pre-processing data to finalize unknown parameter: mtry# Plotting the above results
res_randomforest %>% autoplot()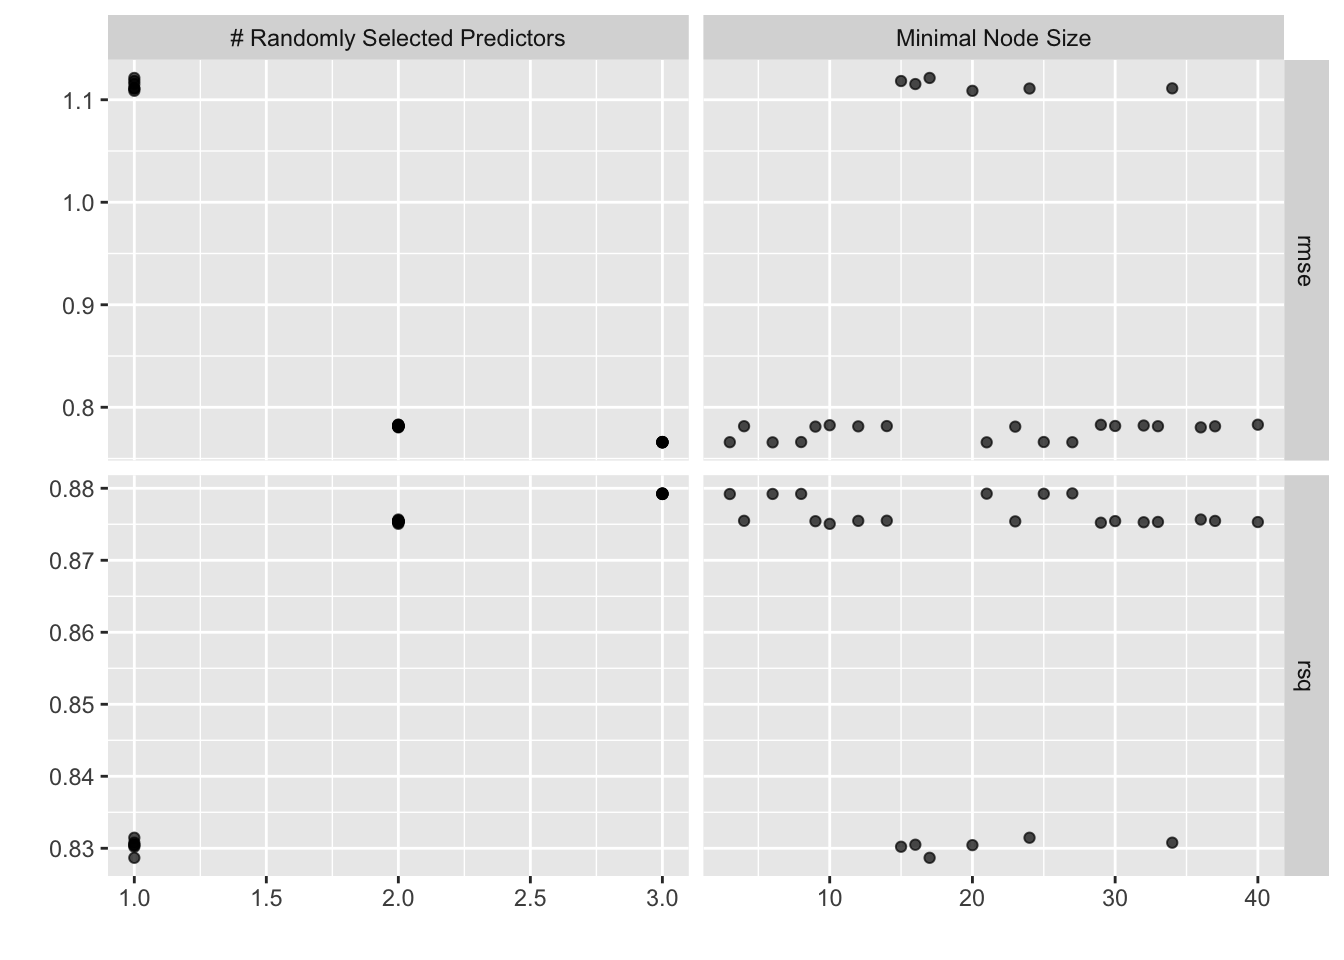
# Getting the best-fit model
res_randomforest %>%
  show_best()
Warning: No value of `metric` was given; metric 'rmse' will be used.# A tibble: 5 × 8
mtry min_n .metric .estimator mean n std_err .config
<int> <int> <chr> <chr> <dbl> <int> <dbl> <chr>
1 3 6 rmse standard 0.766 25 0.0209 Preprocessor1_Model01
2 3 21 rmse standard 0.766 25 0.0209 Preprocessor1_Model25
3 3 27 rmse standard 0.766 25 0.0209 Preprocessor1_Model02
4 3 3 rmse standard 0.766 25 0.0209 Preprocessor1_Model10
5 3 8 rmse standard 0.766 25 0.0209 Preprocessor1_Model15best_randomforest <- res_randomforest %>%
select_best(metric = "rmse")
# Getting summary table for best random forest model
best_randomforestmodel <- res_randomforest %>% show_best("rmse", n = 1) %>%
select(c(.metric, mean, std_err)) %>%
mutate(model = "Random Forest Model")
# Getting the final workflow
final_randomforest_wf <- wf_randomforest %>%
finalize_workflow(best_randomforest)
# Fitting to the training data with the final workflow
final_randomforest_fit <- final_randomforest_wf %>% fit(train_data)
final_randomforest_fit %>% extract_fit_parsnip() %>% vip(num_features = 28)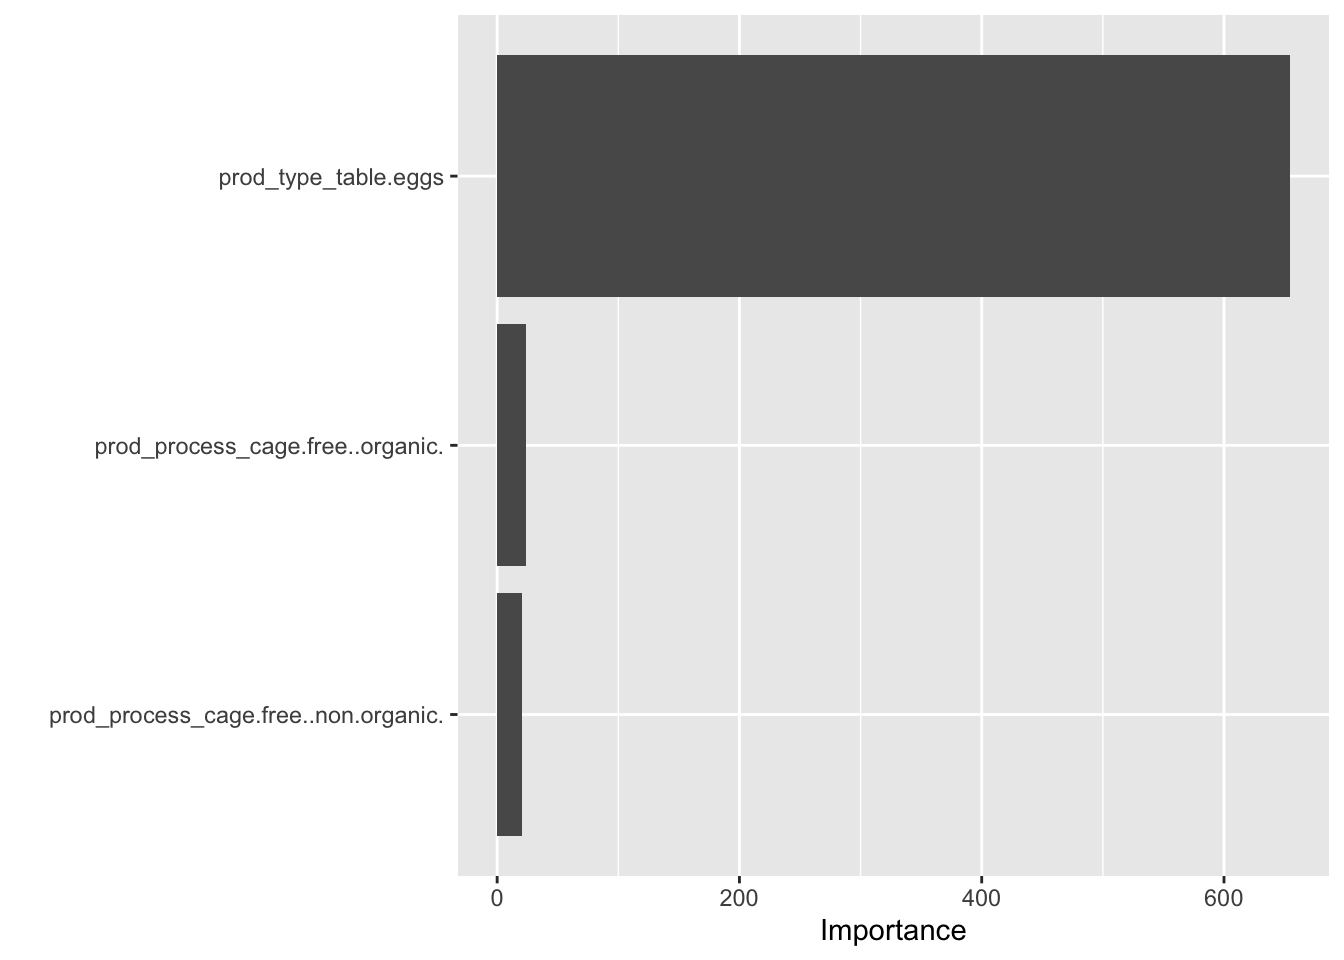
# Plotting the final fit
plot_randomforest <- extract_fit_engine(final_randomforest_fit)
vip(plot_randomforest)
# Predicted outcomes
predicted_randomforest_fit <- predict(final_randomforest_fit, train_data)
From the random forest model, we got RMSE as 0.77.
4. BOOSTED TREE MODEL
# Building the model
model_boostedtree <- boost_tree(tree_depth = tune(), trees = tune(), min_n = tune()) %>%
  set_engine("lightgbm") %>% set_mode("regression")

# We will be using the recipe (recipe_data) that we created above
# Creating the workflow
wf_boostedtree <- workflow() %>%
  add_model(model_boostedtree) %>%
  add_recipe(recipe_data)

# Model tuning
grid_boostedtree <- grid_regular(tree_depth(), trees(), min_n())

# Tuning the model using tune_grid() function
res_boostedtree <- wf_boostedtree %>% tune_grid(resamples = CV_fold_data, grid = grid_boostedtree,
    control = control_grid(save_pred = TRUE), metrics = NULL)
! Fold1, Repeat1: internal:
There were 3 warnings in `dplyr::summarise()`.
The first warning was:
ℹ In argument: `.estimate = metric_fn(truth = eggs_per_hen, estimate =...
na_rm = na_rm)`.
ℹ In group 1: `trees = 1`, `min_n = 40`, `tree_depth = 1`.
Caused by warning:
! A correlation computation is required, but `estimate` is constant an...
ℹ Run `dplyr::last_dplyr_warnings()` to see the 2 remaining warnings.,...
The first warning was:
ℹ In argument: `.estimate = metric_fn(truth = eggs_per_hen, estimate =...
na_rm = na_rm)`.
ℹ In group 1: `trees = 1`, `min_n = 40`, `tree_depth = 8`.
Caused by warning:
! A correlation computation is required, but `estimate` is constant an...
ℹ Run `dplyr::last_dplyr_warnings()` to see the 2 remaining warnings.,...
The first warning was:
ℹ In argument: `.estimate = metric_fn(truth = eggs_per_hen, estimate =...
na_rm = na_rm)`.
ℹ In group 1: `trees = 1`, `min_n = 40`, `tree_depth = 15`.
Caused by warning:
! A correlation computation is required, but `estimate` is constant an...
ℹ Run `dplyr::last_dplyr_warnings()` to see the 2 remaining warnings.! Fold2, Repeat1: internal:
There were 3 warnings in `dplyr::summarise()`.
The first warning was:
ℹ In argument: `.estimate = metric_fn(truth = eggs_per_hen, estimate =...
na_rm = na_rm)`.
ℹ In group 1: `trees = 1`, `min_n = 40`, `tree_depth = 1`.
Caused by warning:
! A correlation computation is required, but `estimate` is constant an...
ℹ Run `dplyr::last_dplyr_warnings()` to see the 2 remaining warnings.,...
The first warning was:
ℹ In argument: `.estimate = metric_fn(truth = eggs_per_hen, estimate =...
na_rm = na_rm)`.
ℹ In group 1: `trees = 1`, `min_n = 40`, `tree_depth = 8`.
Caused by warning:
! A correlation computation is required, but `estimate` is constant an...
ℹ Run `dplyr::last_dplyr_warnings()` to see the 2 remaining warnings.,...
The first warning was:
ℹ In argument: `.estimate = metric_fn(truth = eggs_per_hen, estimate =...
na_rm = na_rm)`.
ℹ In group 1: `trees = 1`, `min_n = 40`, `tree_depth = 15`.
Caused by warning:
! A correlation computation is required, but `estimate` is constant an...
ℹ Run `dplyr::last_dplyr_warnings()` to see the 2 remaining warnings.! Fold3, Repeat1: internal:
There were 3 warnings in `dplyr::summarise()`.
The first warning was:
ℹ In argument: `.estimate = metric_fn(truth = eggs_per_hen, estimate =...
na_rm = na_rm)`.
ℹ In group 1: `trees = 1`, `min_n = 40`, `tree_depth = 1`.
Caused by warning:
! A correlation computation is required, but `estimate` is constant an...
ℹ Run `dplyr::last_dplyr_warnings()` to see the 2 remaining warnings.,...
The first warning was:
ℹ In argument: `.estimate = metric_fn(truth = eggs_per_hen, estimate =...
na_rm = na_rm)`.
ℹ In group 1: `trees = 1`, `min_n = 40`, `tree_depth = 8`.
Caused by warning:
! A correlation computation is required, but `estimate` is constant an...
ℹ Run `dplyr::last_dplyr_warnings()` to see the 2 remaining warnings.,...
The first warning was:
ℹ In argument: `.estimate = metric_fn(truth = eggs_per_hen, estimate =...
na_rm = na_rm)`.
ℹ In group 1: `trees = 1`, `min_n = 40`, `tree_depth = 15`.
Caused by warning:
! A correlation computation is required, but `estimate` is constant an...
ℹ Run `dplyr::last_dplyr_warnings()` to see the 2 remaining warnings.! Fold4, Repeat1: internal:
There were 3 warnings in `dplyr::summarise()`.
The first warning was:
ℹ In argument: `.estimate = metric_fn(truth = eggs_per_hen, estimate =...
na_rm = na_rm)`.
ℹ In group 1: `trees = 1`, `min_n = 40`, `tree_depth = 1`.
Caused by warning:
! A correlation computation is required, but `estimate` is constant an...
ℹ Run `dplyr::last_dplyr_warnings()` to see the 2 remaining warnings.,...
The first warning was:
ℹ In argument: `.estimate = metric_fn(truth = eggs_per_hen, estimate =...
na_rm = na_rm)`.
ℹ In group 1: `trees = 1`, `min_n = 40`, `tree_depth = 8`.
Caused by warning:
! A correlation computation is required, but `estimate` is constant an...
ℹ Run `dplyr::last_dplyr_warnings()` to see the 2 remaining warnings.,...
The first warning was:
ℹ In argument: `.estimate = metric_fn(truth = eggs_per_hen, estimate =...
na_rm = na_rm)`.
ℹ In group 1: `trees = 1`, `min_n = 40`, `tree_depth = 15`.
Caused by warning:
! A correlation computation is required, but `estimate` is constant an...
ℹ Run `dplyr::last_dplyr_warnings()` to see the 2 remaining warnings.! Fold5, Repeat1: internal:
There were 3 warnings in `dplyr::summarise()`.
The first warning was:
ℹ In argument: `.estimate = metric_fn(truth = eggs_per_hen, estimate =...
na_rm = na_rm)`.
ℹ In group 1: `trees = 1`, `min_n = 40`, `tree_depth = 1`.
Caused by warning:
! A correlation computation is required, but `estimate` is constant an...
ℹ Run `dplyr::last_dplyr_warnings()` to see the 2 remaining warnings.,...
The first warning was:
ℹ In argument: `.estimate = metric_fn(truth = eggs_per_hen, estimate =...
na_rm = na_rm)`.
ℹ In group 1: `trees = 1`, `min_n = 40`, `tree_depth = 8`.
Caused by warning:
! A correlation computation is required, but `estimate` is constant an...
ℹ Run `dplyr::last_dplyr_warnings()` to see the 2 remaining warnings.,...
The first warning was:
ℹ In argument: `.estimate = metric_fn(truth = eggs_per_hen, estimate =...
na_rm = na_rm)`.
ℹ In group 1: `trees = 1`, `min_n = 40`, `tree_depth = 15`.
Caused by warning:
! A correlation computation is required, but `estimate` is constant an...
ℹ Run `dplyr::last_dplyr_warnings()` to see the 2 remaining warnings.! Fold1, Repeat2: internal:
There were 3 warnings in `dplyr::summarise()`.
The first warning was:
ℹ In argument: `.estimate = metric_fn(truth = eggs_per_hen, estimate =...
na_rm = na_rm)`.
ℹ In group 1: `trees = 1`, `min_n = 40`, `tree_depth = 1`.
Caused by warning:
! A correlation computation is required, but `estimate` is constant an...
ℹ Run `dplyr::last_dplyr_warnings()` to see the 2 remaining warnings.,...
The first warning was:
ℹ In argument: `.estimate = metric_fn(truth = eggs_per_hen, estimate =...
na_rm = na_rm)`.
ℹ In group 1: `trees = 1`, `min_n = 40`, `tree_depth = 8`.
Caused by warning:
! A correlation computation is required, but `estimate` is constant an...
ℹ Run `dplyr::last_dplyr_warnings()` to see the 2 remaining warnings.,...
The first warning was:
ℹ In argument: `.estimate = metric_fn(truth = eggs_per_hen, estimate =...
na_rm = na_rm)`.
ℹ In group 1: `trees = 1`, `min_n = 40`, `tree_depth = 15`.
Caused by warning:
! A correlation computation is required, but `estimate` is constant an...
ℹ Run `dplyr::last_dplyr_warnings()` to see the 2 remaining warnings.! Fold2, Repeat2: internal:
There were 3 warnings in `dplyr::summarise()`.
The first warning was:
ℹ In argument: `.estimate = metric_fn(truth = eggs_per_hen, estimate =...
na_rm = na_rm)`.
ℹ In group 1: `trees = 1`, `min_n = 40`, `tree_depth = 1`.
Caused by warning:
! A correlation computation is required, but `estimate` is constant an...
ℹ Run `dplyr::last_dplyr_warnings()` to see the 2 remaining warnings.,...
The first warning was:
ℹ In argument: `.estimate = metric_fn(truth = eggs_per_hen, estimate =...
na_rm = na_rm)`.
ℹ In group 1: `trees = 1`, `min_n = 40`, `tree_depth = 8`.
Caused by warning:
! A correlation computation is required, but `estimate` is constant an...
ℹ Run `dplyr::last_dplyr_warnings()` to see the 2 remaining warnings.,...
The first warning was:
ℹ In argument: `.estimate = metric_fn(truth = eggs_per_hen, estimate =...
na_rm = na_rm)`.
ℹ In group 1: `trees = 1`, `min_n = 40`, `tree_depth = 15`.
Caused by warning:
! A correlation computation is required, but `estimate` is constant an...
ℹ Run `dplyr::last_dplyr_warnings()` to see the 2 remaining warnings.! Fold3, Repeat2: internal:
There were 3 warnings in `dplyr::summarise()`.
The first warning was:
ℹ In argument: `.estimate = metric_fn(truth = eggs_per_hen, estimate =...
na_rm = na_rm)`.
ℹ In group 1: `trees = 1`, `min_n = 40`, `tree_depth = 1`.
Caused by warning:
! A correlation computation is required, but `estimate` is constant an...
ℹ Run `dplyr::last_dplyr_warnings()` to see the 2 remaining warnings.,...
The first warning was:
ℹ In argument: `.estimate = metric_fn(truth = eggs_per_hen, estimate =...
na_rm = na_rm)`.
ℹ In group 1: `trees = 1`, `min_n = 40`, `tree_depth = 8`.
Caused by warning:
! A correlation computation is required, but `estimate` is constant an...
ℹ Run `dplyr::last_dplyr_warnings()` to see the 2 remaining warnings.,...
The first warning was:
ℹ In argument: `.estimate = metric_fn(truth = eggs_per_hen, estimate =...
na_rm = na_rm)`.
ℹ In group 1: `trees = 1`, `min_n = 40`, `tree_depth = 15`.
Caused by warning:
! A correlation computation is required, but `estimate` is constant an...
ℹ Run `dplyr::last_dplyr_warnings()` to see the 2 remaining warnings.! Fold4, Repeat2: internal:
There were 3 warnings in `dplyr::summarise()`.
The first warning was:
ℹ In argument: `.estimate = metric_fn(truth = eggs_per_hen, estimate =...
na_rm = na_rm)`.
ℹ In group 1: `trees = 1`, `min_n = 40`, `tree_depth = 1`.
Caused by warning:
! A correlation computation is required, but `estimate` is constant an...
ℹ Run `dplyr::last_dplyr_warnings()` to see the 2 remaining warnings.,...
The first warning was:
ℹ In argument: `.estimate = metric_fn(truth = eggs_per_hen, estimate =...
na_rm = na_rm)`.
ℹ In group 1: `trees = 1`, `min_n = 40`, `tree_depth = 8`.
Caused by warning:
! A correlation computation is required, but `estimate` is constant an...
ℹ Run `dplyr::last_dplyr_warnings()` to see the 2 remaining warnings.,...
The first warning was:
ℹ In argument: `.estimate = metric_fn(truth = eggs_per_hen, estimate =...
na_rm = na_rm)`.
ℹ In group 1: `trees = 1`, `min_n = 40`, `tree_depth = 15`.
Caused by warning:
! A correlation computation is required, but `estimate` is constant an...
ℹ Run `dplyr::last_dplyr_warnings()` to see the 2 remaining warnings.! Fold5, Repeat2: internal:
There were 3 warnings in `dplyr::summarise()`.
The first warning was:
ℹ In argument: `.estimate = metric_fn(truth = eggs_per_hen, estimate =...
na_rm = na_rm)`.
ℹ In group 1: `trees = 1`, `min_n = 40`, `tree_depth = 1`.
Caused by warning:
! A correlation computation is required, but `estimate` is constant an...
ℹ Run `dplyr::last_dplyr_warnings()` to see the 2 remaining warnings.,...
The first warning was:
ℹ In argument: `.estimate = metric_fn(truth = eggs_per_hen, estimate =...
na_rm = na_rm)`.
ℹ In group 1: `trees = 1`, `min_n = 40`, `tree_depth = 8`.
Caused by warning:
! A correlation computation is required, but `estimate` is constant an...
ℹ Run `dplyr::last_dplyr_warnings()` to see the 2 remaining warnings.,...
The first warning was:
ℹ In argument: `.estimate = metric_fn(truth = eggs_per_hen, estimate =...
na_rm = na_rm)`.
ℹ In group 1: `trees = 1`, `min_n = 40`, `tree_depth = 15`.
Caused by warning:
! A correlation computation is required, but `estimate` is constant an...
ℹ Run `dplyr::last_dplyr_warnings()` to see the 2 remaining warnings.! Fold1, Repeat3: internal:
There were 3 warnings in `dplyr::summarise()`.
The first warning was:
ℹ In argument: `.estimate = metric_fn(truth = eggs_per_hen, estimate =...
na_rm = na_rm)`.
ℹ In group 1: `trees = 1`, `min_n = 40`, `tree_depth = 1`.
Caused by warning:
! A correlation computation is required, but `estimate` is constant an...
ℹ Run `dplyr::last_dplyr_warnings()` to see the 2 remaining warnings.,...
The first warning was:
ℹ In argument: `.estimate = metric_fn(truth = eggs_per_hen, estimate =...
na_rm = na_rm)`.
ℹ In group 1: `trees = 1`, `min_n = 40`, `tree_depth = 8`.
Caused by warning:
! A correlation computation is required, but `estimate` is constant an...
ℹ Run `dplyr::last_dplyr_warnings()` to see the 2 remaining warnings.,...
The first warning was:
ℹ In argument: `.estimate = metric_fn(truth = eggs_per_hen, estimate =...
na_rm = na_rm)`.
ℹ In group 1: `trees = 1`, `min_n = 40`, `tree_depth = 15`.
Caused by warning:
! A correlation computation is required, but `estimate` is constant an...
ℹ Run `dplyr::last_dplyr_warnings()` to see the 2 remaining warnings.! Fold2, Repeat3: internal:
There were 3 warnings in `dplyr::summarise()`.
The first warning was:
ℹ In argument: `.estimate = metric_fn(truth = eggs_per_hen, estimate =...
na_rm = na_rm)`.
ℹ In group 1: `trees = 1`, `min_n = 40`, `tree_depth = 1`.
Caused by warning:
! A correlation computation is required, but `estimate` is constant an...
ℹ Run `dplyr::last_dplyr_warnings()` to see the 2 remaining warnings.,...
The first warning was:
ℹ In argument: `.estimate = metric_fn(truth = eggs_per_hen, estimate =...
na_rm = na_rm)`.
ℹ In group 1: `trees = 1`, `min_n = 40`, `tree_depth = 8`.
Caused by warning:
! A correlation computation is required, but `estimate` is constant an...
ℹ Run `dplyr::last_dplyr_warnings()` to see the 2 remaining warnings.,...
The first warning was:
ℹ In argument: `.estimate = metric_fn(truth = eggs_per_hen, estimate =...
na_rm = na_rm)`.
ℹ In group 1: `trees = 1`, `min_n = 40`, `tree_depth = 15`.
Caused by warning:
! A correlation computation is required, but `estimate` is constant an...
ℹ Run `dplyr::last_dplyr_warnings()` to see the 2 remaining warnings.! Fold3, Repeat3: internal:
There were 3 warnings in `dplyr::summarise()`.
The first warning was:
ℹ In argument: `.estimate = metric_fn(truth = eggs_per_hen, estimate =...
na_rm = na_rm)`.
ℹ In group 1: `trees = 1`, `min_n = 40`, `tree_depth = 1`.
Caused by warning:
! A correlation computation is required, but `estimate` is constant an...
ℹ Run `dplyr::last_dplyr_warnings()` to see the 2 remaining warnings.,...
The first warning was:
ℹ In argument: `.estimate = metric_fn(truth = eggs_per_hen, estimate =...
na_rm = na_rm)`.
ℹ In group 1: `trees = 1`, `min_n = 40`, `tree_depth = 8`.
Caused by warning:
! A correlation computation is required, but `estimate` is constant an...
ℹ Run `dplyr::last_dplyr_warnings()` to see the 2 remaining warnings.,...
The first warning was:
ℹ In argument: `.estimate = metric_fn(truth = eggs_per_hen, estimate =...
na_rm = na_rm)`.
ℹ In group 1: `trees = 1`, `min_n = 40`, `tree_depth = 15`.
Caused by warning:
! A correlation computation is required, but `estimate` is constant an...
ℹ Run `dplyr::last_dplyr_warnings()` to see the 2 remaining warnings.! Fold4, Repeat3: internal:
There were 3 warnings in `dplyr::summarise()`.
The first warning was:
ℹ In argument: `.estimate = metric_fn(truth = eggs_per_hen, estimate =...
na_rm = na_rm)`.
ℹ In group 1: `trees = 1`, `min_n = 40`, `tree_depth = 1`.
Caused by warning:
! A correlation computation is required, but `estimate` is constant an...
ℹ Run `dplyr::last_dplyr_warnings()` to see the 2 remaining warnings.,...
The first warning was:
ℹ In argument: `.estimate = metric_fn(truth = eggs_per_hen, estimate =...
na_rm = na_rm)`.
ℹ In group 1: `trees = 1`, `min_n = 40`, `tree_depth = 8`.
Caused by warning:
! A correlation computation is required, but `estimate` is constant an...
ℹ Run `dplyr::last_dplyr_warnings()` to see the 2 remaining warnings.,...
The first warning was:
ℹ In argument: `.estimate = metric_fn(truth = eggs_per_hen, estimate =...
na_rm = na_rm)`.
ℹ In group 1: `trees = 1`, `min_n = 40`, `tree_depth = 15`.
Caused by warning:
! A correlation computation is required, but `estimate` is constant an...
ℹ Run `dplyr::last_dplyr_warnings()` to see the 2 remaining warnings.! Fold5, Repeat3: internal:
There were 3 warnings in `dplyr::summarise()`.
The first warning was:
ℹ In argument: `.estimate = metric_fn(truth = eggs_per_hen, estimate =...
na_rm = na_rm)`.
ℹ In group 1: `trees = 1`, `min_n = 40`, `tree_depth = 1`.
Caused by warning:
! A correlation computation is required, but `estimate` is constant an...
ℹ Run `dplyr::last_dplyr_warnings()` to see the 2 remaining warnings.,...
The first warning was:
ℹ In argument: `.estimate = metric_fn(truth = eggs_per_hen, estimate =...
na_rm = na_rm)`.
ℹ In group 1: `trees = 1`, `min_n = 40`, `tree_depth = 8`.
Caused by warning:
! A correlation computation is required, but `estimate` is constant an...
ℹ Run `dplyr::last_dplyr_warnings()` to see the 2 remaining warnings.,...
The first warning was:
ℹ In argument: `.estimate = metric_fn(truth = eggs_per_hen, estimate =...
na_rm = na_rm)`.
ℹ In group 1: `trees = 1`, `min_n = 40`, `tree_depth = 15`.
Caused by warning:
! A correlation computation is required, but `estimate` is constant an...
ℹ Run `dplyr::last_dplyr_warnings()` to see the 2 remaining warnings.! Fold1, Repeat4: internal:
There were 3 warnings in `dplyr::summarise()`.
The first warning was:
ℹ In argument: `.estimate = metric_fn(truth = eggs_per_hen, estimate =...
na_rm = na_rm)`.
ℹ In group 1: `trees = 1`, `min_n = 40`, `tree_depth = 1`.
Caused by warning:
! A correlation computation is required, but `estimate` is constant an...
ℹ Run `dplyr::last_dplyr_warnings()` to see the 2 remaining warnings.,...
The first warning was:
ℹ In argument: `.estimate = metric_fn(truth = eggs_per_hen, estimate =...
na_rm = na_rm)`.
ℹ In group 1: `trees = 1`, `min_n = 40`, `tree_depth = 8`.
Caused by warning:
! A correlation computation is required, but `estimate` is constant an...
ℹ Run `dplyr::last_dplyr_warnings()` to see the 2 remaining warnings.,...
The first warning was:
ℹ In argument: `.estimate = metric_fn(truth = eggs_per_hen, estimate =...
na_rm = na_rm)`.
ℹ In group 1: `trees = 1`, `min_n = 40`, `tree_depth = 15`.
Caused by warning:
! A correlation computation is required, but `estimate` is constant an...
ℹ Run `dplyr::last_dplyr_warnings()` to see the 2 remaining warnings.! Fold2, Repeat4: internal:
There were 3 warnings in `dplyr::summarise()`.
The first warning was:
ℹ In argument: `.estimate = metric_fn(truth = eggs_per_hen, estimate =...
na_rm = na_rm)`.
ℹ In group 1: `trees = 1`, `min_n = 40`, `tree_depth = 1`.
Caused by warning:
! A correlation computation is required, but `estimate` is constant an...
ℹ Run `dplyr::last_dplyr_warnings()` to see the 2 remaining warnings.,...
The first warning was:
ℹ In argument: `.estimate = metric_fn(truth = eggs_per_hen, estimate =...
na_rm = na_rm)`.
ℹ In group 1: `trees = 1`, `min_n = 40`, `tree_depth = 8`.
Caused by warning:
! A correlation computation is required, but `estimate` is constant an...
ℹ Run `dplyr::last_dplyr_warnings()` to see the 2 remaining warnings.,...
The first warning was:
ℹ In argument: `.estimate = metric_fn(truth = eggs_per_hen, estimate =...
na_rm = na_rm)`.
ℹ In group 1: `trees = 1`, `min_n = 40`, `tree_depth = 15`.
Caused by warning:
! A correlation computation is required, but `estimate` is constant an...
ℹ Run `dplyr::last_dplyr_warnings()` to see the 2 remaining warnings.! Fold3, Repeat4: internal:
There were 3 warnings in `dplyr::summarise()`.
The first warning was:
ℹ In argument: `.estimate = metric_fn(truth = eggs_per_hen, estimate =...
na_rm = na_rm)`.
ℹ In group 1: `trees = 1`, `min_n = 40`, `tree_depth = 1`.
Caused by warning:
! A correlation computation is required, but `estimate` is constant an...
ℹ Run `dplyr::last_dplyr_warnings()` to see the 2 remaining warnings.,...
The first warning was:
ℹ In argument: `.estimate = metric_fn(truth = eggs_per_hen, estimate =...
na_rm = na_rm)`.
ℹ In group 1: `trees = 1`, `min_n = 40`, `tree_depth = 8`.
Caused by warning:
! A correlation computation is required, but `estimate` is constant an...
ℹ Run `dplyr::last_dplyr_warnings()` to see the 2 remaining warnings.,...
The first warning was:
ℹ In argument: `.estimate = metric_fn(truth = eggs_per_hen, estimate =...
na_rm = na_rm)`.
ℹ In group 1: `trees = 1`, `min_n = 40`, `tree_depth = 15`.
Caused by warning:
! A correlation computation is required, but `estimate` is constant an...
ℹ Run `dplyr::last_dplyr_warnings()` to see the 2 remaining warnings.! Fold4, Repeat4: internal:
There were 3 warnings in `dplyr::summarise()`.
The first warning was:
ℹ In argument: `.estimate = metric_fn(truth = eggs_per_hen, estimate =...
na_rm = na_rm)`.
ℹ In group 1: `trees = 1`, `min_n = 40`, `tree_depth = 1`.
Caused by warning:
! A correlation computation is required, but `estimate` is constant an...
ℹ Run `dplyr::last_dplyr_warnings()` to see the 2 remaining warnings.,...
The first warning was:
ℹ In argument: `.estimate = metric_fn(truth = eggs_per_hen, estimate =...
na_rm = na_rm)`.
ℹ In group 1: `trees = 1`, `min_n = 40`, `tree_depth = 8`.
Caused by warning:
! A correlation computation is required, but `estimate` is constant an...
ℹ Run `dplyr::last_dplyr_warnings()` to see the 2 remaining warnings.,...
The first warning was:
ℹ In argument: `.estimate = metric_fn(truth = eggs_per_hen, estimate =...
na_rm = na_rm)`.
ℹ In group 1: `trees = 1`, `min_n = 40`, `tree_depth = 15`.
Caused by warning:
! A correlation computation is required, but `estimate` is constant an...
ℹ Run `dplyr::last_dplyr_warnings()` to see the 2 remaining warnings.! Fold5, Repeat4: internal:
There were 3 warnings in `dplyr::summarise()`.
The first warning was:
ℹ In argument: `.estimate = metric_fn(truth = eggs_per_hen, estimate =...
na_rm = na_rm)`.
ℹ In group 1: `trees = 1`, `min_n = 40`, `tree_depth = 1`.
Caused by warning:
! A correlation computation is required, but `estimate` is constant an...
ℹ Run `dplyr::last_dplyr_warnings()` to see the 2 remaining warnings.,...
The first warning was:
ℹ In argument: `.estimate = metric_fn(truth = eggs_per_hen, estimate =...
na_rm = na_rm)`.
ℹ In group 1: `trees = 1`, `min_n = 40`, `tree_depth = 8`.
Caused by warning:
! A correlation computation is required, but `estimate` is constant an...
ℹ Run `dplyr::last_dplyr_warnings()` to see the 2 remaining warnings.,...
The first warning was:
ℹ In argument: `.estimate = metric_fn(truth = eggs_per_hen, estimate =...
na_rm = na_rm)`.
ℹ In group 1: `trees = 1`, `min_n = 40`, `tree_depth = 15`.
Caused by warning:
! A correlation computation is required, but `estimate` is constant an...
ℹ Run `dplyr::last_dplyr_warnings()` to see the 2 remaining warnings.! Fold1, Repeat5: internal:
There were 3 warnings in `dplyr::summarise()`.
The first warning was:
ℹ In argument: `.estimate = metric_fn(truth = eggs_per_hen, estimate =...
na_rm = na_rm)`.
ℹ In group 1: `trees = 1`, `min_n = 40`, `tree_depth = 1`.
Caused by warning:
! A correlation computation is required, but `estimate` is constant an...
ℹ Run `dplyr::last_dplyr_warnings()` to see the 2 remaining warnings.,...
The first warning was:
ℹ In argument: `.estimate = metric_fn(truth = eggs_per_hen, estimate =...
na_rm = na_rm)`.
ℹ In group 1: `trees = 1`, `min_n = 40`, `tree_depth = 8`.
Caused by warning:
! A correlation computation is required, but `estimate` is constant an...
ℹ Run `dplyr::last_dplyr_warnings()` to see the 2 remaining warnings.,...
The first warning was:
ℹ In argument: `.estimate = metric_fn(truth = eggs_per_hen, estimate =...
na_rm = na_rm)`.
ℹ In group 1: `trees = 1`, `min_n = 40`, `tree_depth = 15`.
Caused by warning:
! A correlation computation is required, but `estimate` is constant an...
ℹ Run `dplyr::last_dplyr_warnings()` to see the 2 remaining warnings.! Fold2, Repeat5: internal:
There were 3 warnings in `dplyr::summarise()`.
The first warning was:
ℹ In argument: `.estimate = metric_fn(truth = eggs_per_hen, estimate =...
na_rm = na_rm)`.
ℹ In group 1: `trees = 1`, `min_n = 40`, `tree_depth = 1`.
Caused by warning:
! A correlation computation is required, but `estimate` is constant an...
ℹ Run `dplyr::last_dplyr_warnings()` to see the 2 remaining warnings.,...
The first warning was:
ℹ In argument: `.estimate = metric_fn(truth = eggs_per_hen, estimate =...
na_rm = na_rm)`.
ℹ In group 1: `trees = 1`, `min_n = 40`, `tree_depth = 8`.
Caused by warning:
! A correlation computation is required, but `estimate` is constant an...
ℹ Run `dplyr::last_dplyr_warnings()` to see the 2 remaining warnings.,...
The first warning was:
ℹ In argument: `.estimate = metric_fn(truth = eggs_per_hen, estimate =...
na_rm = na_rm)`.
ℹ In group 1: `trees = 1`, `min_n = 40`, `tree_depth = 15`.
Caused by warning:
! A correlation computation is required, but `estimate` is constant an...
ℹ Run `dplyr::last_dplyr_warnings()` to see the 2 remaining warnings.! Fold3, Repeat5: internal:
There were 3 warnings in `dplyr::summarise()`.
The first warning was:
ℹ In argument: `.estimate = metric_fn(truth = eggs_per_hen, estimate =...
na_rm = na_rm)`.
ℹ In group 1: `trees = 1`, `min_n = 40`, `tree_depth = 1`.
Caused by warning:
! A correlation computation is required, but `estimate` is constant an...
ℹ Run `dplyr::last_dplyr_warnings()` to see the 2 remaining warnings.,...
The first warning was:
ℹ In argument: `.estimate = metric_fn(truth = eggs_per_hen, estimate =...
na_rm = na_rm)`.
ℹ In group 1: `trees = 1`, `min_n = 40`, `tree_depth = 8`.
Caused by warning:
! A correlation computation is required, but `estimate` is constant an...
ℹ Run `dplyr::last_dplyr_warnings()` to see the 2 remaining warnings.,...
The first warning was:
ℹ In argument: `.estimate = metric_fn(truth = eggs_per_hen, estimate =...
na_rm = na_rm)`.
ℹ In group 1: `trees = 1`, `min_n = 40`, `tree_depth = 15`.
Caused by warning:
! A correlation computation is required, but `estimate` is constant an...
ℹ Run `dplyr::last_dplyr_warnings()` to see the 2 remaining warnings.! Fold4, Repeat5: internal:
There were 3 warnings in `dplyr::summarise()`.
The first warning was:
ℹ In argument: `.estimate = metric_fn(truth = eggs_per_hen, estimate =...
na_rm = na_rm)`.
ℹ In group 1: `trees = 1`, `min_n = 40`, `tree_depth = 1`.
Caused by warning:
! A correlation computation is required, but `estimate` is constant an...
ℹ Run `dplyr::last_dplyr_warnings()` to see the 2 remaining warnings.,...
The first warning was:
ℹ In argument: `.estimate = metric_fn(truth = eggs_per_hen, estimate =...
na_rm = na_rm)`.
ℹ In group 1: `trees = 1`, `min_n = 40`, `tree_depth = 8`.
Caused by warning:
! A correlation computation is required, but `estimate` is constant an...
ℹ Run `dplyr::last_dplyr_warnings()` to see the 2 remaining warnings.,...
The first warning was:
ℹ In argument: `.estimate = metric_fn(truth = eggs_per_hen, estimate =...
na_rm = na_rm)`.
ℹ In group 1: `trees = 1`, `min_n = 40`, `tree_depth = 15`.
Caused by warning:
! A correlation computation is required, but `estimate` is constant an...
ℹ Run `dplyr::last_dplyr_warnings()` to see the 2 remaining warnings.! Fold5, Repeat5: internal:
There were 3 warnings in `dplyr::summarise()`.
The first warning was:
ℹ In argument: `.estimate = metric_fn(truth = eggs_per_hen, estimate =...
na_rm = na_rm)`.
ℹ In group 1: `trees = 1`, `min_n = 40`, `tree_depth = 1`.
Caused by warning:
! A correlation computation is required, but `estimate` is constant an...
ℹ Run `dplyr::last_dplyr_warnings()` to see the 2 remaining warnings.,...
The first warning was:
ℹ In argument: `.estimate = metric_fn(truth = eggs_per_hen, estimate =...
na_rm = na_rm)`.
ℹ In group 1: `trees = 1`, `min_n = 40`, `tree_depth = 8`.
Caused by warning:
! A correlation computation is required, but `estimate` is constant an...
ℹ Run `dplyr::last_dplyr_warnings()` to see the 2 remaining warnings.,...
The first warning was:
ℹ In argument: `.estimate = metric_fn(truth = eggs_per_hen, estimate =...
na_rm = na_rm)`.
ℹ In group 1: `trees = 1`, `min_n = 40`, `tree_depth = 15`.
Caused by warning:
! A correlation computation is required, but `estimate` is constant an...
ℹ Run `dplyr::last_dplyr_warnings()` to see the 2 remaining warnings.# Plotting the above results
res_boostedtree %>% autoplot()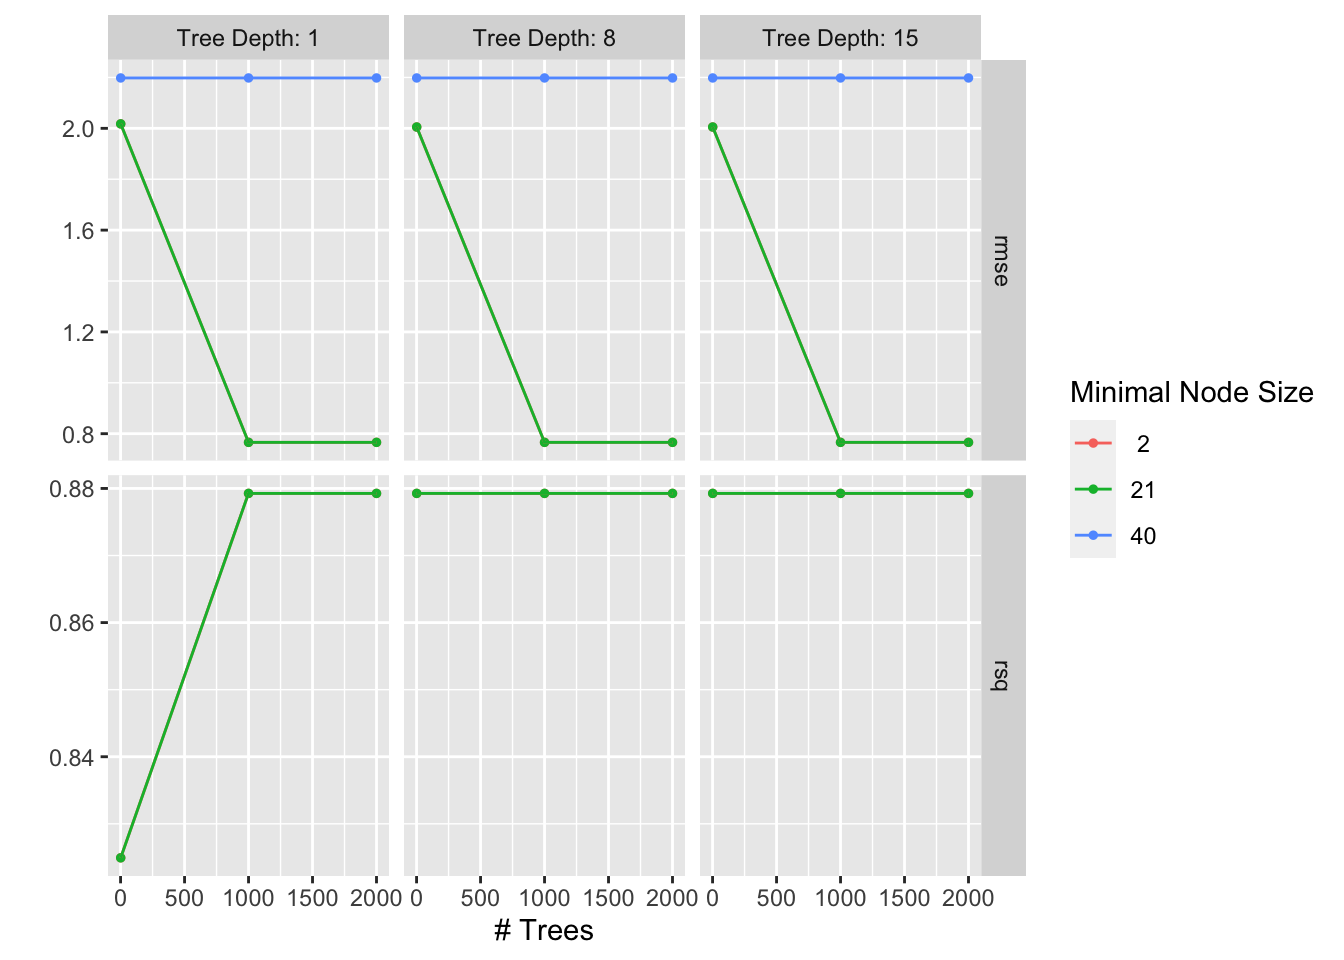
# Getting the best-fit model
res_boostedtree %>%
  show_best()
Warning: No value of `metric` was given; metric 'rmse' will be used.# A tibble: 5 × 9
trees min_n tree_depth .metric .estimator mean n std_err .config
<int> <int> <int> <chr> <chr> <dbl> <int> <dbl> <chr>
1 1000 2 1 rmse standard 0.766 25 0.0209 Preprocessor1_M…
2 1000 21 1 rmse standard 0.766 25 0.0209 Preprocessor1_M…
3 2000 2 1 rmse standard 0.766 25 0.0209 Preprocessor1_M…
4 2000 21 1 rmse standard 0.766 25 0.0209 Preprocessor1_M…
5 1000 2 8 rmse standard 0.766 25 0.0209 Preprocessor1_M…best_boostedtree <- res_boostedtree %>%
select_best(metric = "rmse")
# Getting summary table for best random forest model
best_boostedtree <- res_boostedtree %>% show_best("rmse", n = 1) %>%
select(c(.metric, mean, std_err)) %>%
mutate(model = "Boosted Tree Model")
# Getting the final workflow
final_boostedtree_wf <- wf_boostedtree %>%
finalize_workflow(best_boostedtree)From the boosted model, we got RMSE as 0.77.
COMPARING MODELS
models_summary <- bind_rows(best_decisiontree, best_lasso, best_randomforestmodel, best_boostedtree)
models_summary
# A tibble: 4 × 4
.metric mean std_err model
<chr> <dbl> <dbl> <chr>
1 rmse 0.766 0.0209 Decision Tree Model
2 rmse 0.766 0.0209 Lasso Model
3 rmse 0.766 0.0209 Random Forest Model
4 rmse 0.766 0.0209 Boosted Tree Model We got rmse from our Null model as 2.16 and based on the above summary table, all the other 4 models performed better compared to the null model. There was almost no difference among those 4 models. I chose Decision tree model as the best model due to its easy interpretation, robustness, and less risk of over fitting issues.
FINAL EVALUATION
# Fitting the final Lasso model on test data
final_decisiontree_test <- final_wf %>% last_fit(data_split)

final_decisiontree_test %>% collect_metrics()
# A tibble: 2 × 4
.metric .estimator .estimate .config
<chr> <chr> <dbl> <chr>
1 rmse standard 0.705 Preprocessor1_Model1
2 rsq standard 0.894 Preprocessor1_Model1DISCUSSION
The TidyTuesday data for week 15 was imported for this exercise. Data exploration, wrangling, and visualization was done. Data plots showed differences in the average number of eggs per hens by production type and process so research question was developed to see if there occurs any association. Null linear model was run for metrics comparison. Along with the null model, 4 other models (Decision tree, Lasso, Random forest, and Boosted tree models) were performed. Based on the RMSE and easy interpretation, Decision tree model was selected which performed much better than the null model and this model could be used to address our research question.